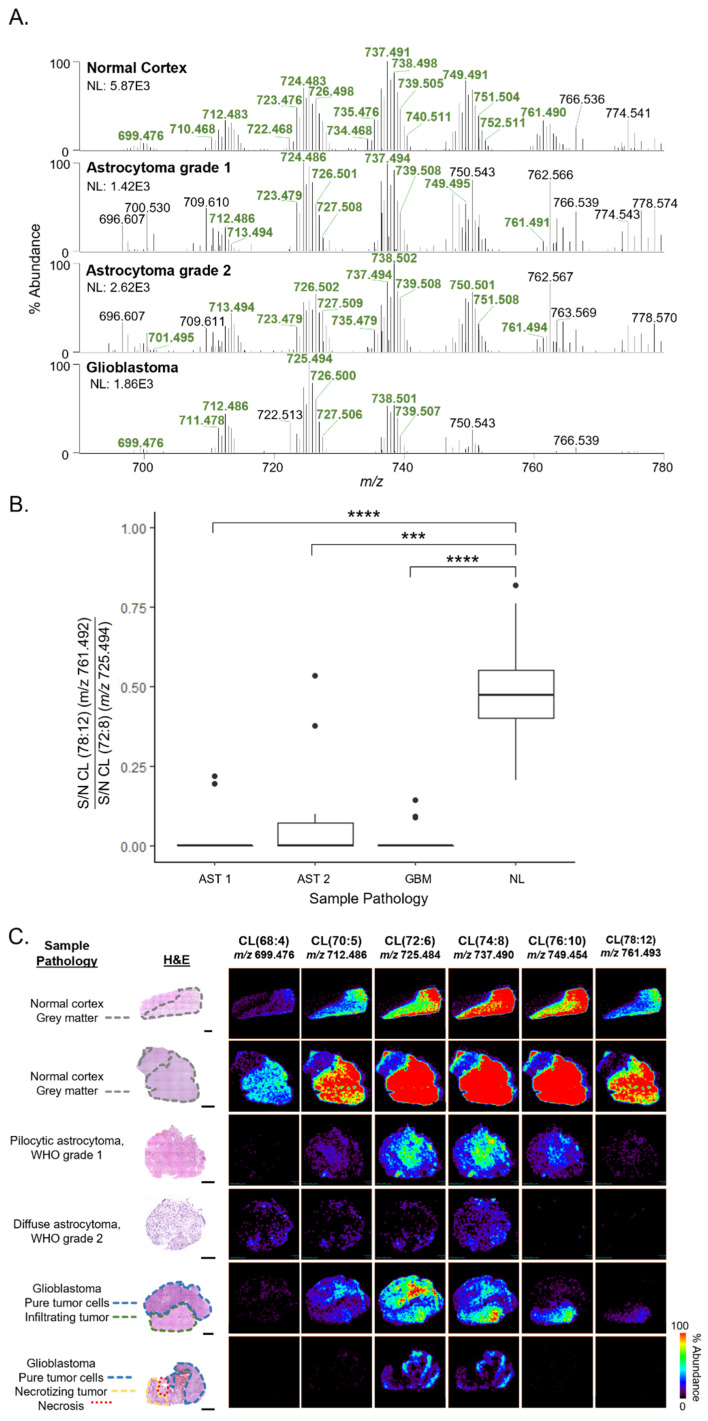
Figure 1.
Differences in CL profiles detected by DESI-FAIMS-MS analysis of NL, AST grades 1 and 2, and GBM tissues. (A) Representative negative ion mode DESI-FAIMS-MS spectra from m/z 690–780 from NL, AST, and GBM tissues. Spectra are an average of 10 scans. The m/z flags of ions corresponding to CL are bolded in green. (B) Boxplot comparing S/N of longer chain CL 78:12 (m/z 761) with shorter chain CL 72:8 (m/z 725). Wilcoxon tests with Holm adjustment were performed for multiple comparisons. All pairwise comparisons were performed, only significant results are displayed (*** p ≤ 0.001, **** p ≤ 0.0001). (C) DESI-FAIMS-MS ion images of six CL species from NL, AST, and GBM tissues. Optical images of H&E-stained tissues are the same tissue section that was analyzed by MS imaging. “Sample pathology” information indicates tissue pathology and histological regions of interest for each sample. All scale bars are 2 mm.

