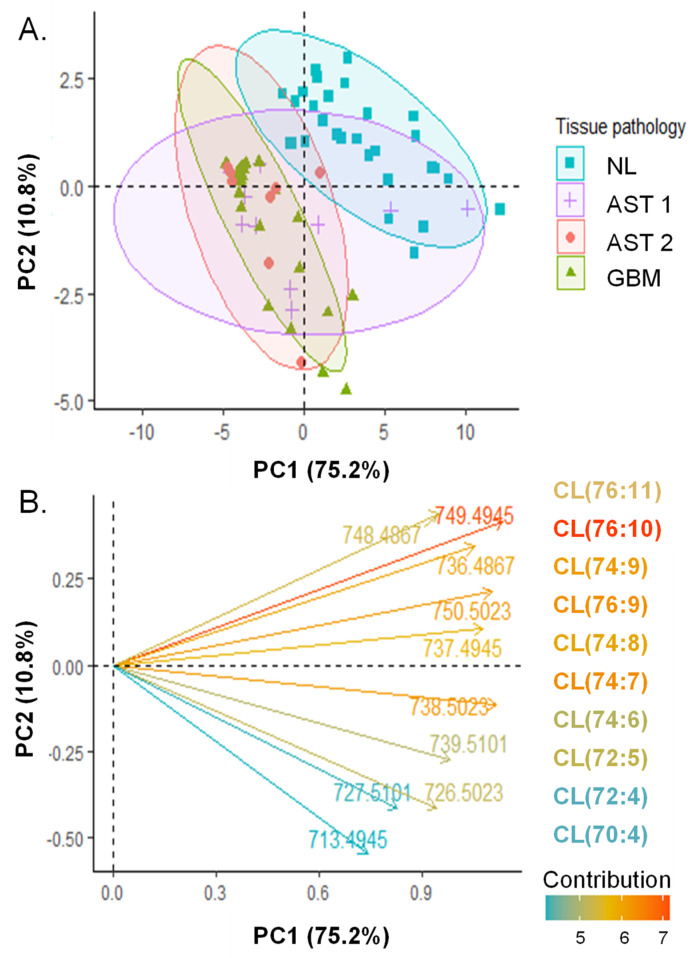
Figure 2.
Principal component analysis of CL profiles extracted from regions of pure tumor cell or normal grey matter analyzed by DESI-FAIMS-MS. (A) Score plot of individuals. S/N of CL species were extracted from DESI-FAIMS-MS pixels corresponding to regions of pure, viable tumor or normal grey matter and averaged on a per-patient basis. Data are centered and log transformed. PC1 and PC2 account for 75.2% and 10.8% of dataset variability, respectively. 90% concentration ellipses are shown. (B) Loading plot showing the direction of contribution of the 10 m/z features with the highest contribution to the PCs. Feature vectors and their corresponding molecular species are colored according to their contribution (%).

