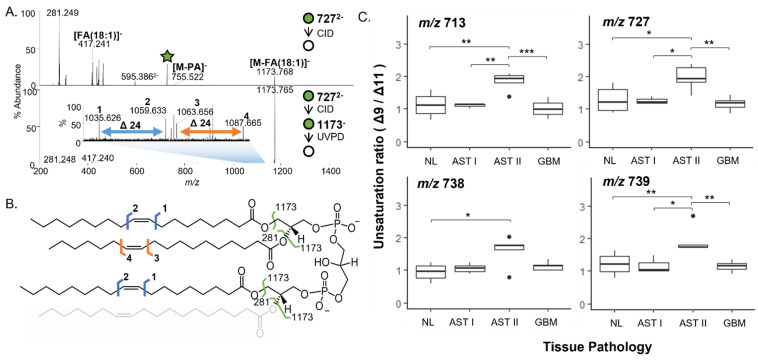
Figure 3.
CID-UVPD-MS analysis of double bond isomer ratios. (A) CID (top) and CID-UVPD (bottom) mass spectra from MSn analysis of m/z 727 (CL(72:4)). (B) Fragmentation map of CL(72:4). Fragments resulting from MS2 analysis are depicted in green. Double bond isomer fragments diagnostic of Δ9 and Δ11 unsaturation are depicted in blue and orange, respectively. (C) Boxplots comparing unsaturation ratios for FA(18:1) chains from CL species containing at least 3 FA(18:1) chains at m/z 713 (upper left), 727 (upper right), 738 (bottom left) and 739 (bottom right) among NL (N = 8), AST grade 1 (N = 3), AST grade 2 (N = 5), and GBM (N = 8) mitochondrial lipid extracts. Shapiro-Wilk tests were used to determine normality of distributions to inform use of non/parametric testing. t-tests (m/z 713, 727, 738) and Wilcoxon (m/z 739) for pairwise hypothesis tests and Holm adjustment for multiple comparisons. All pairwise comparisons were performed, only significant results are displayed (* p ≤ 0.05, ** p ≤ 0.01, *** p ≤ 0.001).

