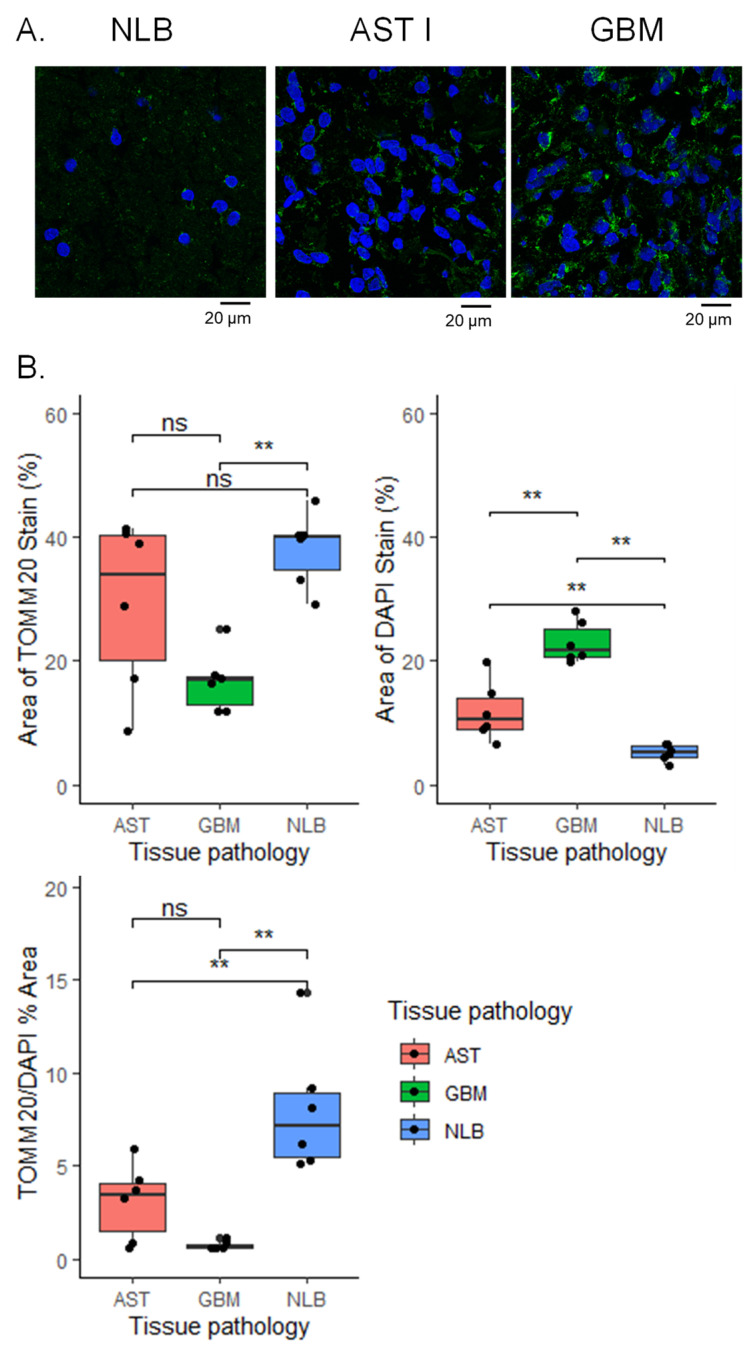
Figure 4.
Changes in mitochondrial and cellular density are observed in immunofluorescence images of AST grade I and GBM tissues versus NLB tissue. (A) Representative confocal images for NL, AST grade 1, and GBM tissues stained with anti-mitochondrial antibody (green) and DAPI nuclear stain (blue). Scale bar = 20 µm. Brightness was increased uniformly by 20% for both channels in all images. (B) Area fraction analysis comparing area % positive for DAPI nuclear staining (top left), area % positive for TOMM20 staining (top right) and TOMM20 area % normalized by DAPI area % (bottom left). For NL (N = 3), AST 1 (N = 3), and GBM (N = 3), area fraction ratios obtained from 2 regions of interest were averaged from regions of pure tumor cells or normal grey matter. Wilcoxon with holm adjustment for multiple comparisons was used to determine differences among groups. ** p ≤ 0.01; ns, not significant.

