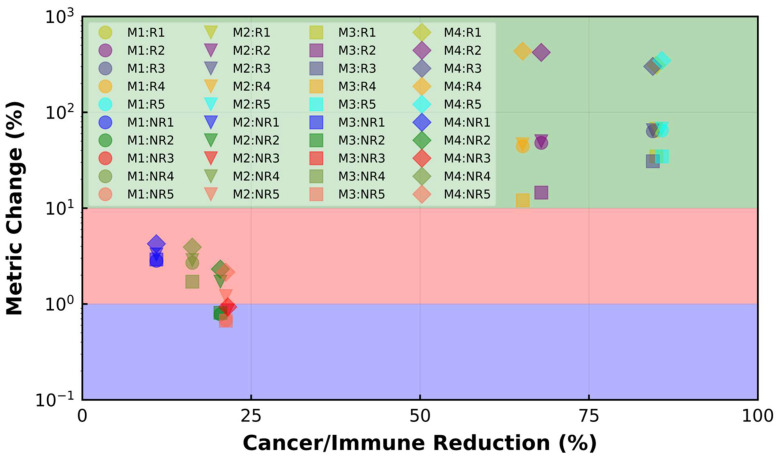
Figure 12.
The change percentage in different spatial metrics for R and NR cases versus reduction percent of the ratio of cancer cells to immune cells. M1: mixing score; M2: average neighbor frequency; M3: AUC of the G-cross function; M4: Shannon’s entropy. Green: compartmentalized; red: mixed; purple: cold. A change of less than 1% happens when the TME remains cold during treatment. The change between 1% and 10% is linked to the mixed TME, while a change above 10% in the spatial metrics happens when the compartmentalized patterns are observed after treatment. All the R cases have compartmentalized patterns, while all the NR cases have either cold or mixed immunoarchitectural patterns.

