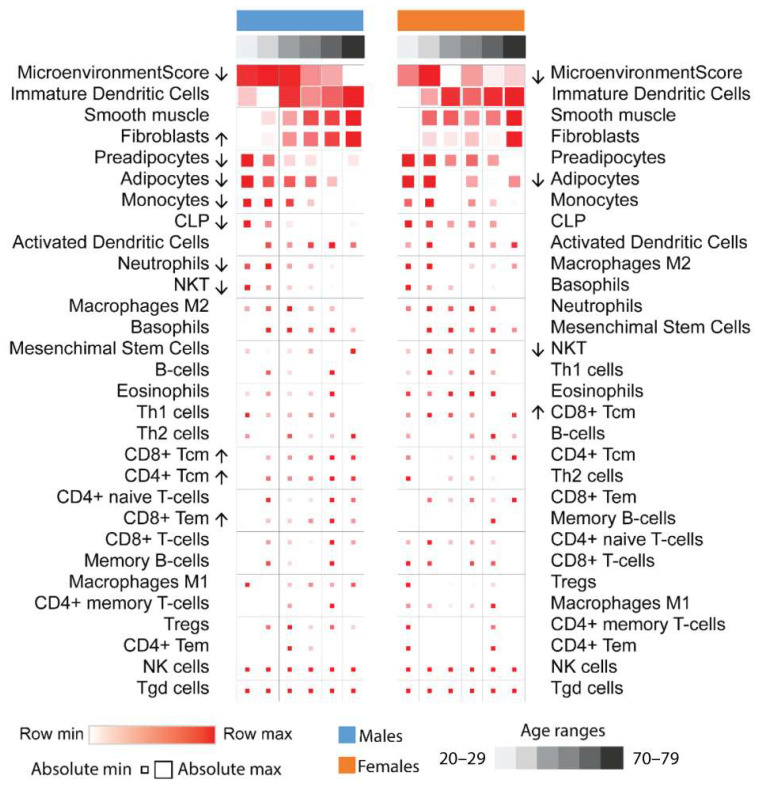
Figure 2.
Cellular deconvolution analysis. Mean cell signature scores of each age range were calculated using XCell, which estimates cell-type populations based on transcriptomics data. Arrows indicate significance (p < 0.05) for trends with aging according to the one–way ANOVA test. Adipocyte, preadipocyte, monocyte, natural killer cell (NKT), and neutrophil populations decrease with age in males, while fibroblast and some lymphocyte populations increase. These patterns were similar in females but were not significant. Row values are normalized by Z-score, so minimum and maximum values are row relative and reflected by color. Absolute nonrelative values are reflected by square size.

