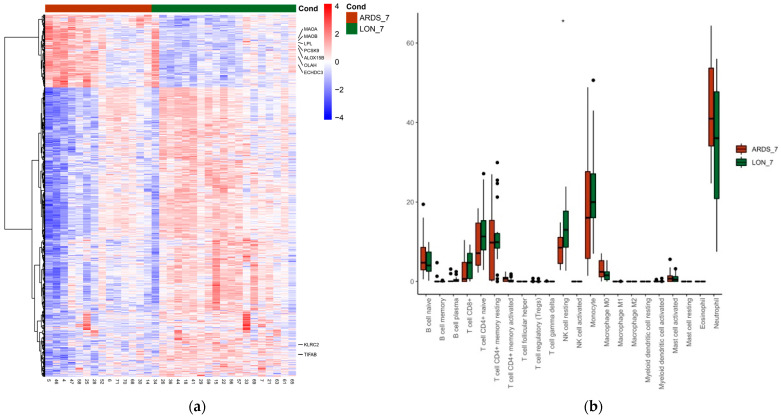
Figure 3.
(a) Heatmap depicting the gene expression of differentially expressed genes (DEGs) comparing COVID-19 patients with ARDS at any given time by day 7 of hospital admission (ARDS_7) and those who did not (LON_7). Each column in the figure represents a sample, and each row represents a gene. The colors in the graph indicate the magnitude of gene expression in the sample. Red indicates that the gene is highly expressed in the sample, and blue indicates that the gene expression is low. Genes included have an absolute log2 fold change of more than 1 and an adjusted p value of <0.05. Genes related to lipid control (e.g., OLAH, ECHDC3, PCSK9, LPL), oxidation (e.g., MAOA, MAOB), polyubiquitination, and metalloproteinases were upregulated in patients who had presented with ARDS by day 7. (b) COVID-19 patients with ARDS at any given time by day 7 of hospital admission (ARDS_7) and those who did not (LON_7) CIBERSORT deconvolution analysis and comparison. Significance is noted by: * for p-value < 0.05.

