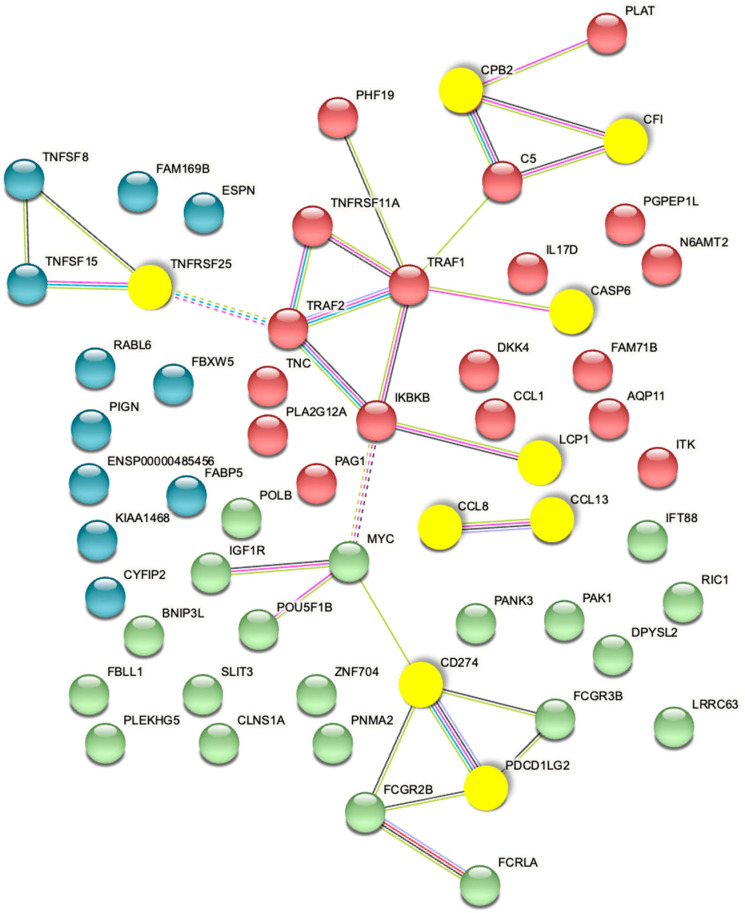
Figure 7.
STRING Network associated with baseline prediction of response/non-response to ICI treatment. The proteins encoded by genes in the top 3D genomic markers associated with baseline response/non-response to ICI profile show a highly connected network. The yellow nodes mark the coding regions associated with the top eight markers of the validated classifier.

