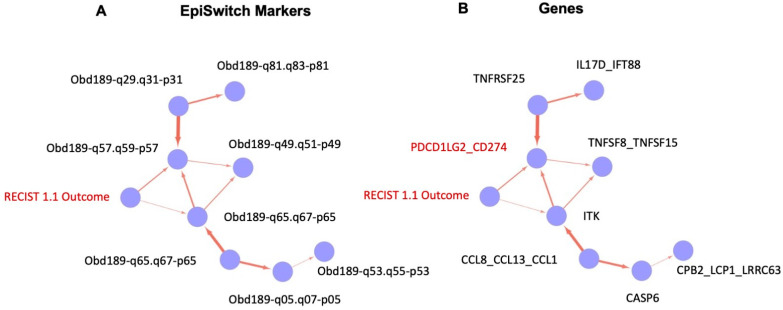
Figure 9.
Causal graphs (Bayesian causal networks) based on training set of the EpiSwitch biomarkers and clinical outcome of IO treatment. Probabilistic relationship of the EpiSwitch markers and RECIST 1.1 assessment of IO treatment outcome, based on 3D genomic architecture (A) and gene identities at the sites of EpiSwitch markers (B). The edge in (B) marks the causal relationship between RECIST 1.1 outcome and PD-L1 (CD274)-based EpiSwitch marker (marked in red, see also Figure 8 for the detailed location of the marker).

