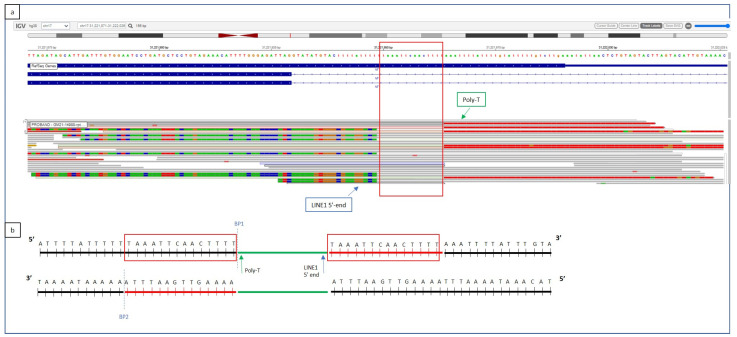
Figure 3.
(a) Whole Genome Sequencing output from TruSight Software (Illumina). (b) Graphical representation of the LINE-1 insertion site. WGS shows the insertion of a poly-T segment within intron 15, 32 bases downstream of exon 15, corresponding to the 3′ poly-A end of the LINE-1 transposable element (green arrow). The 14-base duplicated region, normally located at both the extremities of the LINE-1 insertion, as a consequence of its integration mechanism, is reported as a red square. The first bases of the 5′ end of the inverted and truncated LINE-1 element are visible on WGS (a) as mismatched strings at the left side of the insertion (blue arrow). The inserted sequences are represented according to their base composition color (red for T, green for A, brown for G, blue for C).

