Figure 1.
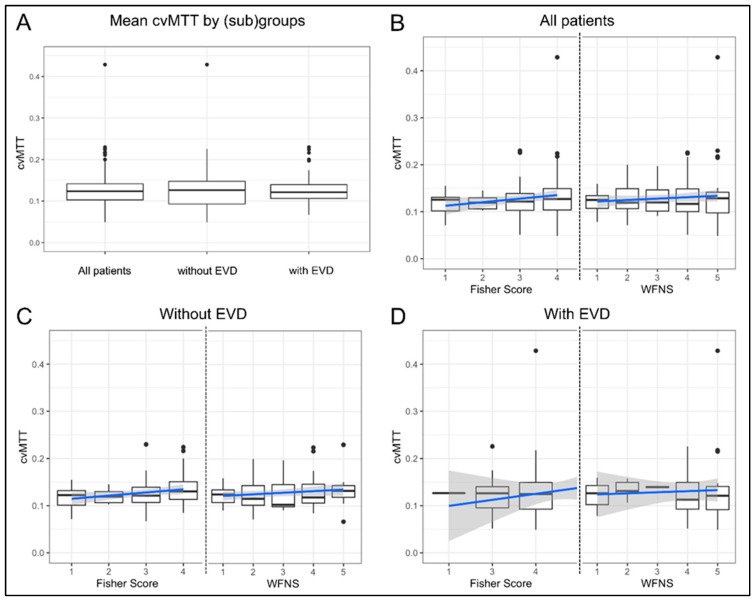
Mean cvMTT and correlation of cvMTT with Fisher and WFNS grades (boxplot with overlaid linear regression). (A) There is no significant difference between the mean cvMTT for all patients (n = 124) and the subgroups of patients with (n = 79) and without EVD (n = 45) at the time of CTP imaging. (B) cvMTT distribution of the Fisher grade (left) and the WFNS grades (right) for all patients. The cvMTT did not correlate with the initial WFNS grade (p = 0.23) or Fisher grade (p = 0.07) at admission. (C) cvMTT distribution of the Fisher grade (left) and the WFNS grades (right) in the subgroup of patients without EVD. The cvMTT did not correlate with the initial WFNS grade (p = 0.15) but correlated weakly with the Fisher grade (p = 0.05) at admission. (D) cvMTT distribution of the Fisher grade (left) and the WFNS grades (right) in the subgroup of patients with EVD. The cvMTT did not correlate with the initial WFNS grade (p = 0.76) or Fisher grade (p = 0.39) at admission. All figures: black dots = outliers; blue = regression line; grey = confidence band. The dotted line separates the two scales, Fisher score and WFNS grade.

