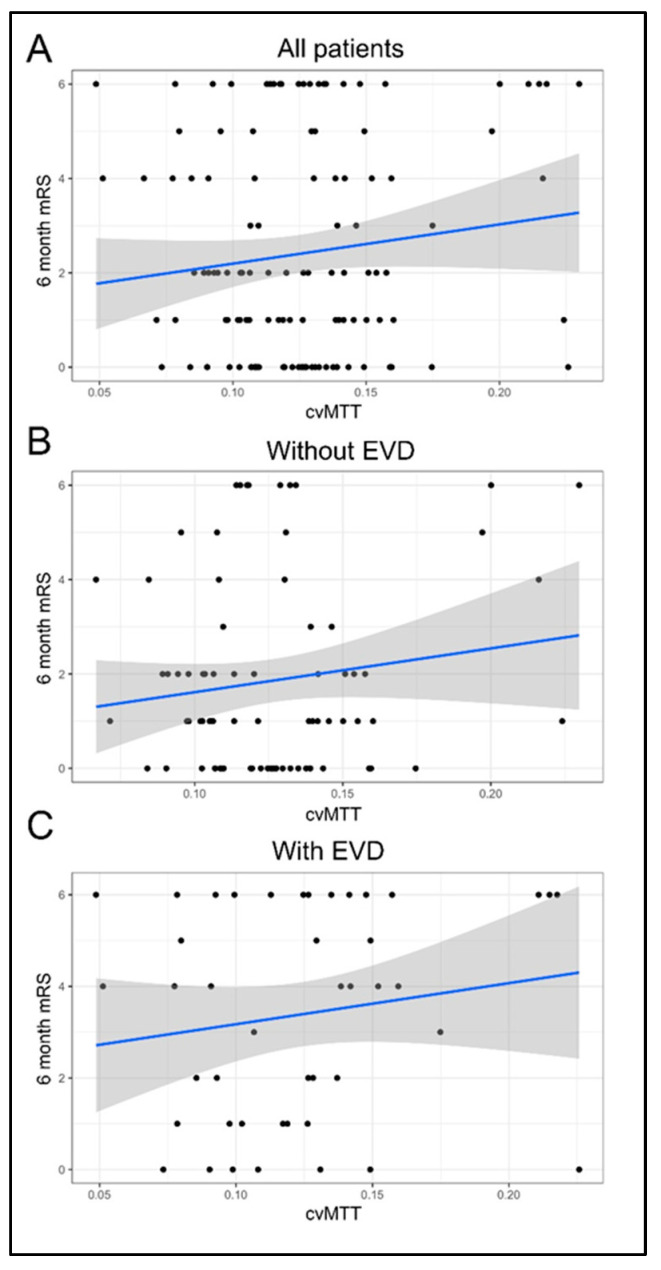
Figure 2.
Correlation of cvMTT with the outcome after 6 months. (A) cvMTT as a predictor of the mRS after 6 months for all patients (linear regression: β = 8.3, 95% CI = (−3, 19.6); p = 0.15). (B) cvMTT as a predictor of the mRS after 6 months in the subgroup of patients without EVD (linear regression: β = 9.3, 95% CI = (−5.1, 23.7); p = 0.21). (C) cvMTT as a predictor of the mRS after 6 months in the subgroup of patients with EVD (linear regression: β = 9, 95% CI = (−7.7, 25.6); p = 0.3). All figures: black = empirical data; blue = regression line; grey = confidence band.

