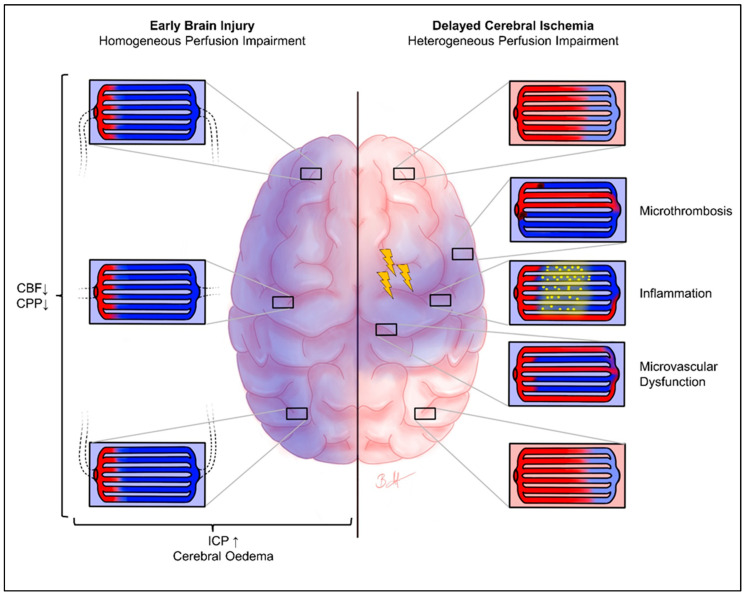
Figure 3.
Heterogeneity of cerebral perfusion: EBI vs. DCI. Chematical representation of brain oxygenation in the phase of EBI (left) with homogeneous microvascular perfusion impairment, as well as DCI (right) with heterogeneous microvascular perfusion impairment. The blue staining shows potentially hypoxic areas, and the red coloring shows regular oxygenation. The enlarged images show the pathological processes that may be present in the respective areas. In the EBI phase, there is a uniformly distributed hypoxia of the entire brain parenchyma. In contrast, the DCI phase shows a heterogeneous picture of the microvascular perfusion of the brain parenchyma, due to various pathomechanisms (only chemically indicated here). The yellow flashes symbolize possible cortical spreading depolarization/depression. Arrows pointing upwards symbolise an increase, arrows pointing downwards symbolise a decrease. CBF, cerebral blood flow; CPP, cerebral perfusion pressure; ICP, intracranial pressure.

