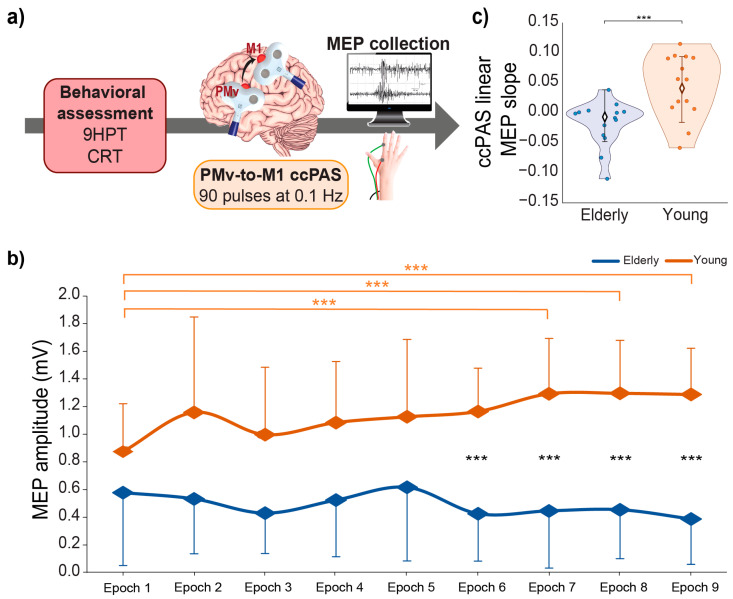
Figure 1.
(a) Experimental design. Behavioral assessment was followed by the administration of a ccPAS protocol over the left PMv and M1. For each paired PMv-M1 stimulation of the ccPAS protocol, an MEP was collected from the right FDI; (b) mean MEP amplitudes recorded during the ccPAS in elderly (blue) and young (orange) participants along 9 epochs; (c) linear slope of MEP increase during ccPAS in the two groups. Error bars represent standard deviations; *** p ≤ 0.001.

