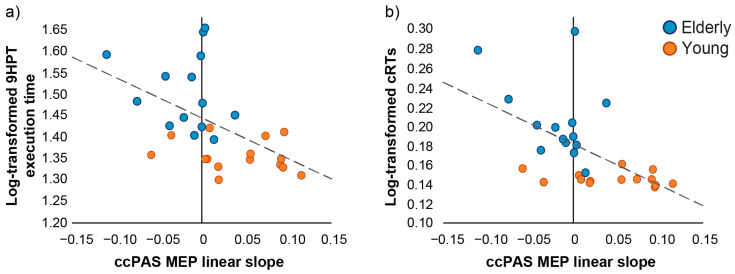
Figure 3.
Relation between the neurophysiological marker of STDP (ccPAS MEP linear slope) and motor performance assessed at baseline. The STDP index predicts both 9HPT execution times (a) and cRTs (b) execution times across age groups, showing that larger MEP slope (reflecting greater plasticity) is associated with faster motor performance at baseline. Orange dots represent young participants (N = 14) and blue dots represent elderly participants (N = 14). Dashed lines depict the regression line of the significant predictor ccPAS MEP linear slope on 9HPT execution times (a) and cRTs (b) across groups.

