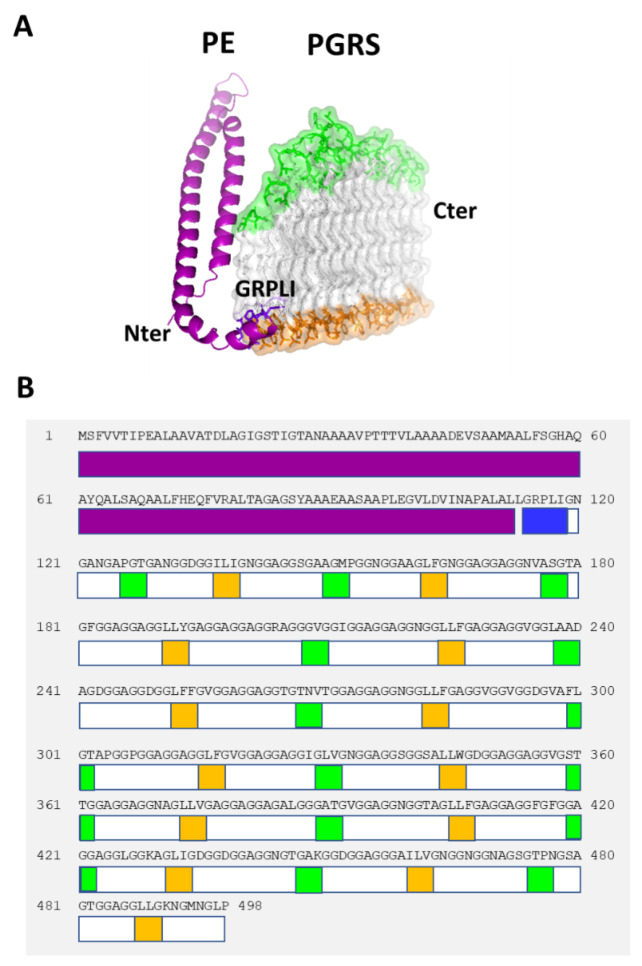
Figure 1.
A schematic view of PE_PGRS33 structure. (A) Cartoon representation of PE_PGRS33 Alphafold2 model. (B) A scheme of domain boundaries and localisation of head and foot residues. The PE domain is represented in purple, the GRPLI motif in blue, head residues in green, foot residues in orange.

