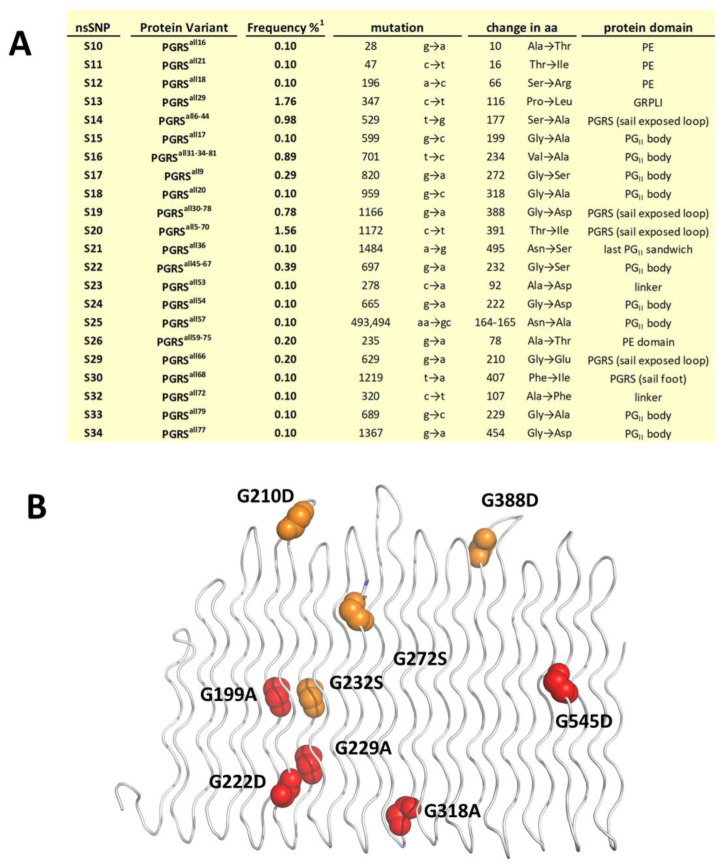
Figure 4.
SNPs on PE_PGRS33 protein. (A) Frequencies of SNPs in PE_PGRS33 and (B) localisation of Gly mutations on the structure of PGRS33allRv. Gly mutations are shown as red (frequency 0.10) and orange (frequency > 0.10) balls. (Frequency%1 in panel A reports pe_pgrs33 allele frequencies as indicated in Supplementary Table S1 and shown in Figure 3).

