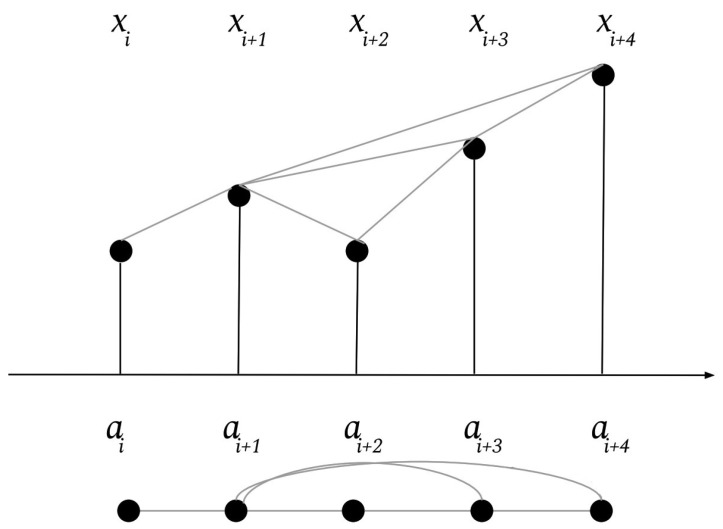
Figure 2.
The top graph represents a time series and the edges between points signify which points can see each other. The bottom graph represents the VG of the time series, with nodes corresponding to timepoints and edges corresponding to lines of visibility. EEG Voltage at time i, VG node for timepoint i.

