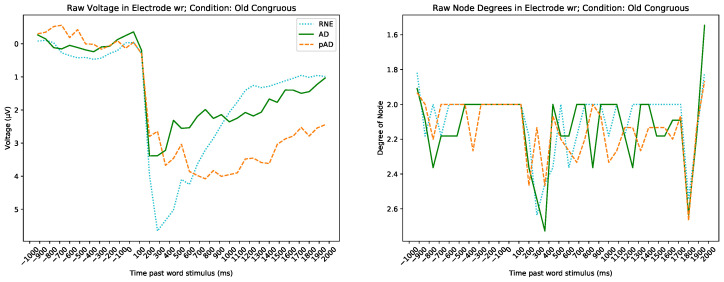
Figure 3.
The raw band averaged voltage time series on the left, corresponding averaged degree sequences on the right. Each timepoint (represented by a unique node in the VG) in the left graph is represented by the average EEG voltage for each group; in the right graph it is represented by the average degree for its associated node in each group.

