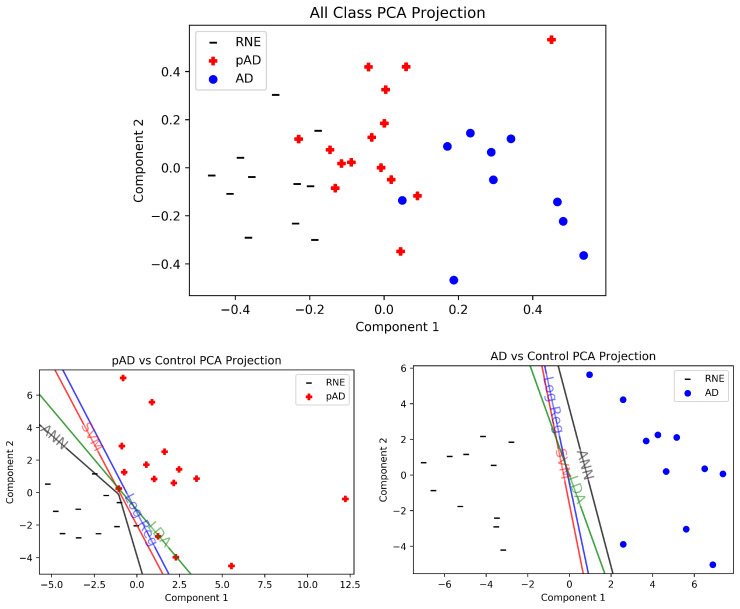
Figure 4.
Two-dimensional PCA projections of data with associated decision boundaries for all classifiers, datapoints and comparisons. For each plot, the PCA components were computed with only the data in the plot to see the actual input to the ML algorithms. Top: Comparison of all classes, using the 72 extracted features from AD vs. RNE. The datapoints from all classes are projected together down to 2 dimensions for a 3-way comparison. pAD patients are intermediate to the RNE and AD patients, as expected. Bottom Left: pAD and RNE are also distinctly separated, resulting in excellent performance in our results by all classifiers. Bottom Right: In two dimensions, we easily see that AD and RNE are linearly separable with the features we extracted.

