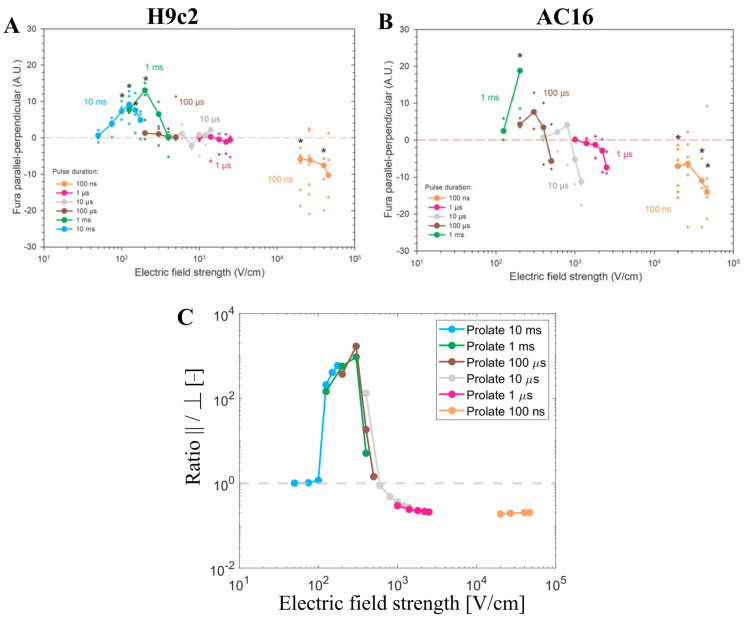
Figure 5.
Experimental measurements of calcium transients using Fura-2 ratio 340/380 peak change using H9c2 and AC16 cell lines when different pulse durations were applied (from 10 ms down to 100 ns) published by Dermol-Černe et al. (A,B). *—statistically significant differences from control (p < 0.05), the Kruskal–Wallis One Way Analysis of Variance on Ranks, followed by Multiple Comparisons versus Control Group (the Dunn’s Method), see Dermol-Černe et al. [31]. Figure 5 (A,B) are reprinted with permission from [31]. (C) represents the ratio of the number of pores parallel/perpendicular obtained with the model using pulse durations and the electric field strengths of the one used in the experiments (A,B). The symbol [-] in the Y axis of (C) indicates that the unit of the ratio parallel/perpendicular is adimensional.

