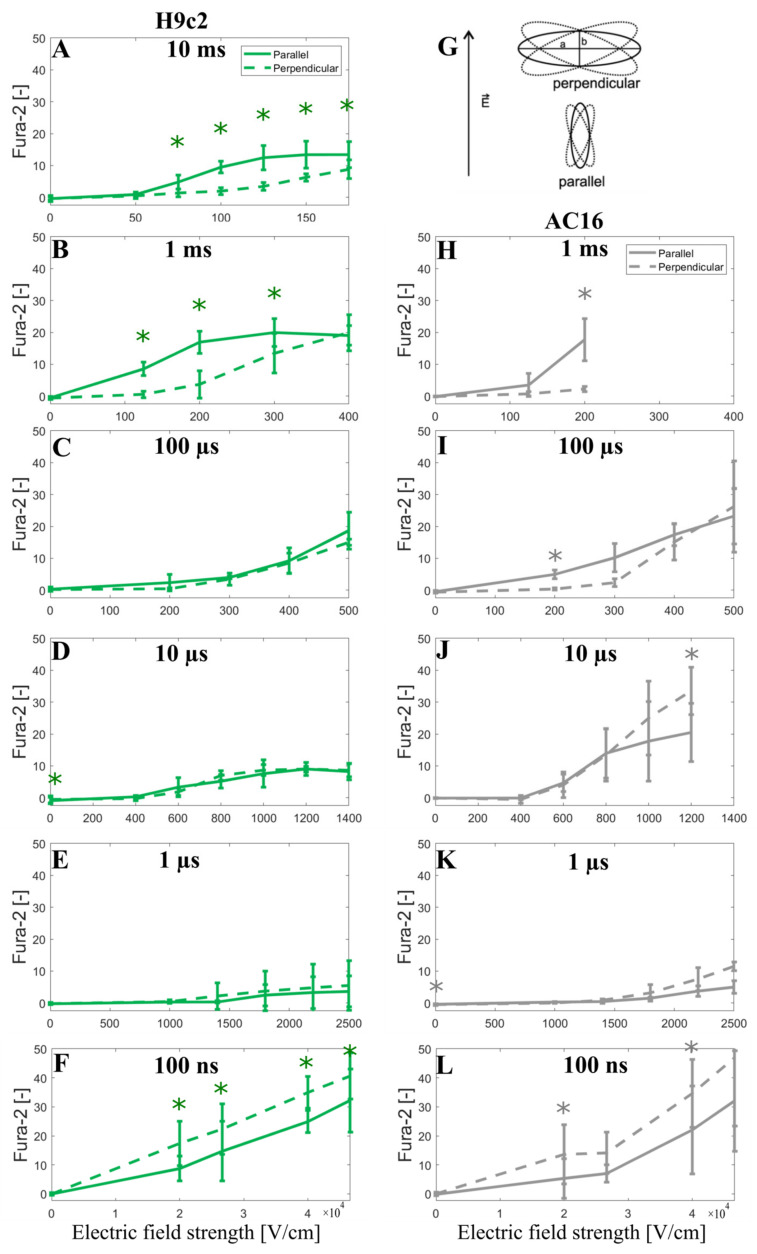
Figure 6.
Fura-2 ratio 340/380 peak change as a function of the applied electric field using H9c2 cell line (A–F) and AC16 cell line (H–L) when a single pulse of either 10 ms, 1 ms, 100 µs, 10 µs, 1 µs, and 100 ns long is applied. (G) represents the elongated cells (a > 2b) with their longer axes (a) oriented parallel or perpendicular to the applied electric field E, with 20° tolerance in angle. The symbol [-] in the Y axis of (A–F,H–L) indicates that the unit of Fura-2 signal is adimensional. Experimental results of H9c2 cells (A–F) were obtained from 5–30 cells per experiment, an average of three independent experiments, except for 1 ms (N = 4), 10 ms (N = 5), 100 ns, 40 and 46.6 kV/cm (N = 5), 100 ns, 20 kV/cm (N = 6), and 100 ns, 26.6 kV/cm (N = 9). Experimental results of AC16 cells (H–L) were obtained from 4–23 cells per experiment, an average of three independent experiments, except for 100 ns, 40 kV/cm (N = 5), 100 ns, 46.6 kV/cm (N = 6), 100 ns, 20 kV/cm (N = 7) and 100 ns, 26.6 kV/cm (N = 7). N is the number of repetitions. Results are expressed as a mean ± standard deviation. *—statistically significant differences from control (p < 0.5), paired t-test.

