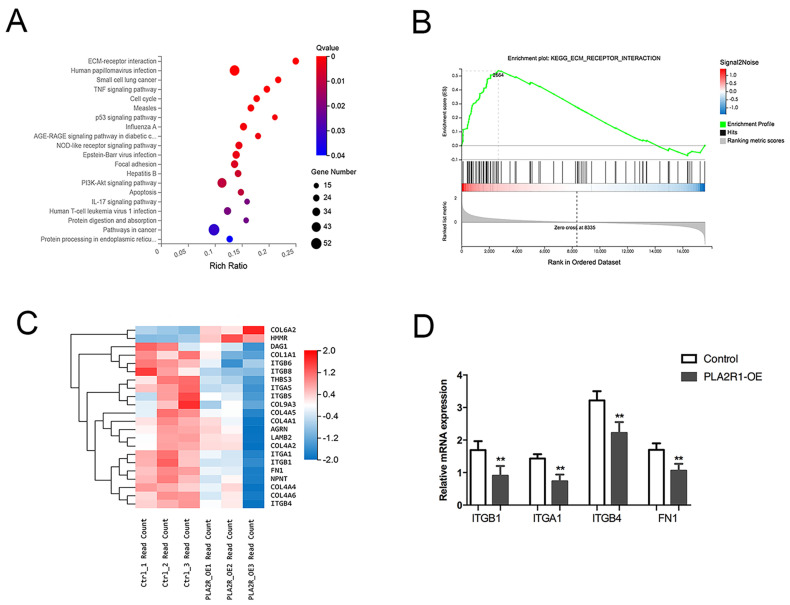
Figure 4.
PLA2R1 affects the expression of extracellular matrix-associated molecules. (A) KEGG pathway analysis showed the top 20 enriched pathways. (B) Enrichment plot of ECM-receptor interaction pathway genes. (C) Heatmap of DEGs, mainly including the integrin family and FN1. (D) The relative mRNA expression of ITGB1, ITGA1, ITGB4 and FN1 after PLA2R1 overexpression. ** p value < 0.01.

