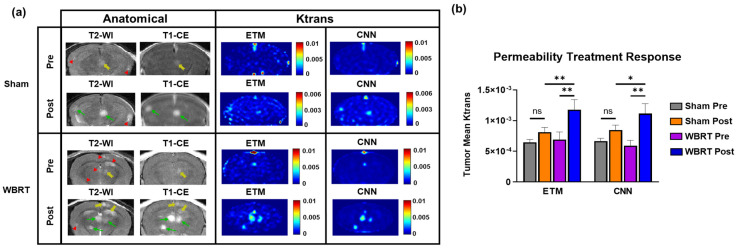
Figure 5.
Investigation of permeability changes pre- and post-sham/WBRT. (a) Anatomical MR images revealed multifocal lesion development with differential permeability for both sham and WBRT treatments. Green arrows, yellow arrows, and red arrowheads correspond to enhanced, minimally enhanced, and non-enhanced lesions, respectively. Corresponding pre- and post-treatment ETM and CNN maps revealed increases in permeability parameter Ktrans post-treatment, which is in good agreement for both sham and WBRT treatments. (b) Quantification of tumor mean Ktrans permeability treatment response. Despite an increase in Ktrans post-treatment, no statistical significance was found between pre- and post-sham irradiation treatment groups for both the ETM and CNN. Significant increases in tumor mean Ktrans were found for the WBRT treatment groups for both the ETM (p-value = 0.0022) and CNN (p-value = 0.001). Post-WBRT lesions had significantly higher tumor mean Ktrans than post-sham irradiation lesions for both the ETM (p-value = 0.0067) and the CNN (p-value = 0.0454). Mean ± SEM, * p < 0.05, ** p < 0.01.

