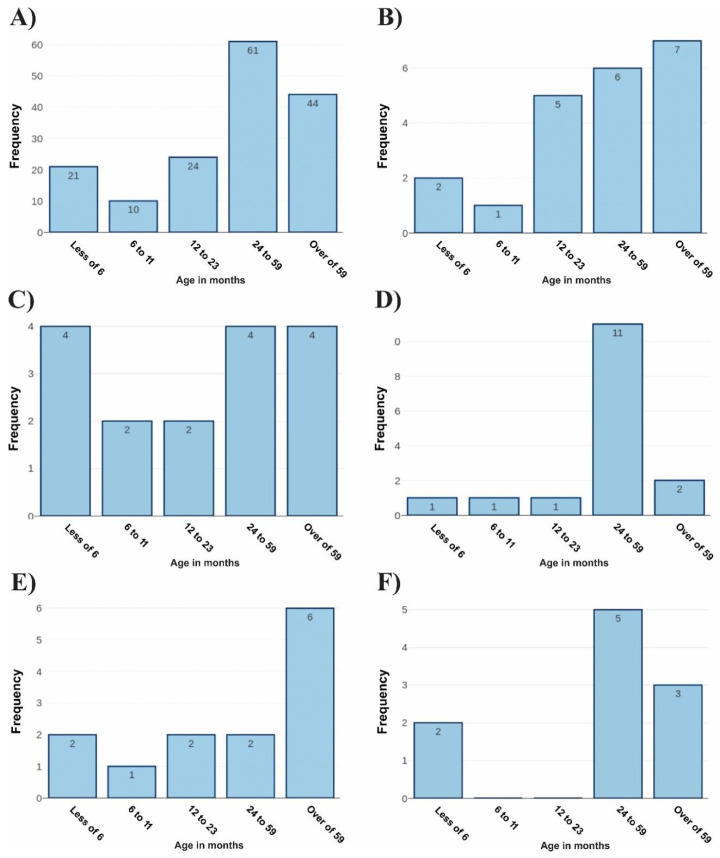
Figure 5.
Analysis of the age group of co-infected patients. Legend: (A) representation of the age group of patients in relation to all coinfections analyzed during the study. (B) The age range of patients co-infected with hRV and SARS-CoV-2. (C) The age group of individuals co-infected with RSV and SARS-CoV-2. (D) The age group of patients co-infected with Rhinovirus and RSV. (E) Individuals affected by hRV and hBoV. In (F), individuals affected by coinfections caused by hRV and AdV had their age profile highlighted.

