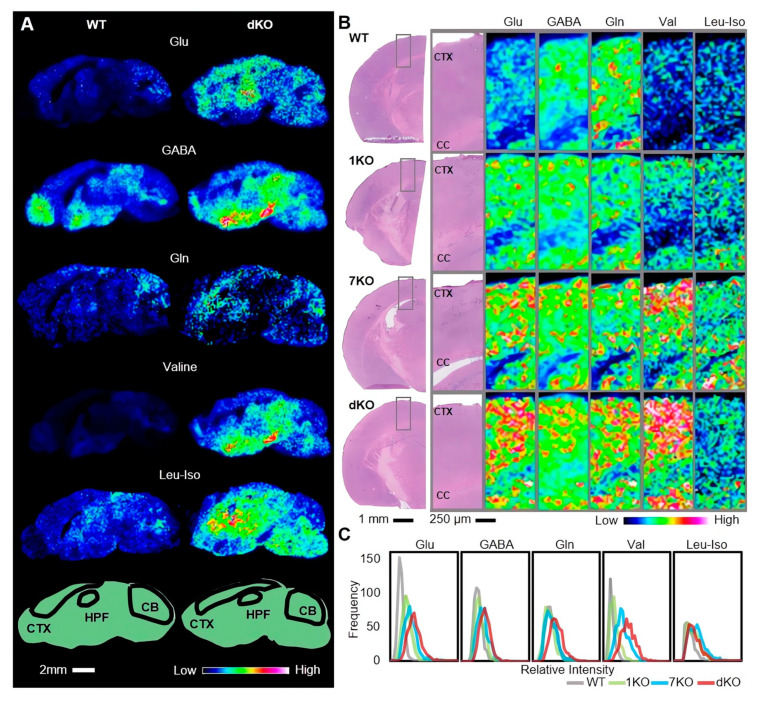
Figure 3.
Knockout of Ttll1 and Ttll7 changes the distribution and concentration of glutamate in the mouse brain. (A) The signal intensity of glutamate, GABA, glutamine, valine, and leucine/isoleucine in the sagittal brain is shown on a rainbow color scale, CTX, HPF, and CB regions (indicated by black circles in the bellow panel), (WT: n = 3 mice; dKO: n = 3 mice). (B) Hematoxylin and eosin (HE) stained WT, and Ttll knockout mice brain coronal sections (scale bar, 1 mm). The signal intensity of glutamate, GABA, glutamine, valine, and leucine/isoleucine in the cortical area of coronal brain sections are shown in a rainbow color scale, (WT: n = 1 mouse; 1KO: n = 1 mouse; 7KO: n = 1 mouse; dKO: n = 1 mouse). (C) The frequency of the relative intensity of each spot in the same cortical region of Ttll knockout and WT mice brains is represented in line graphs. Abbreviations: Glu: glutamate; GABA: γ-aminobutyric acid; Gln: glutamine; Val: valine; Leu-Iso: leucine-isoleucine, 1KO: Ttll1 knockout; 7KO: Ttll7 knockout; dKO: Ttll1/Ttll7 double knockout.

