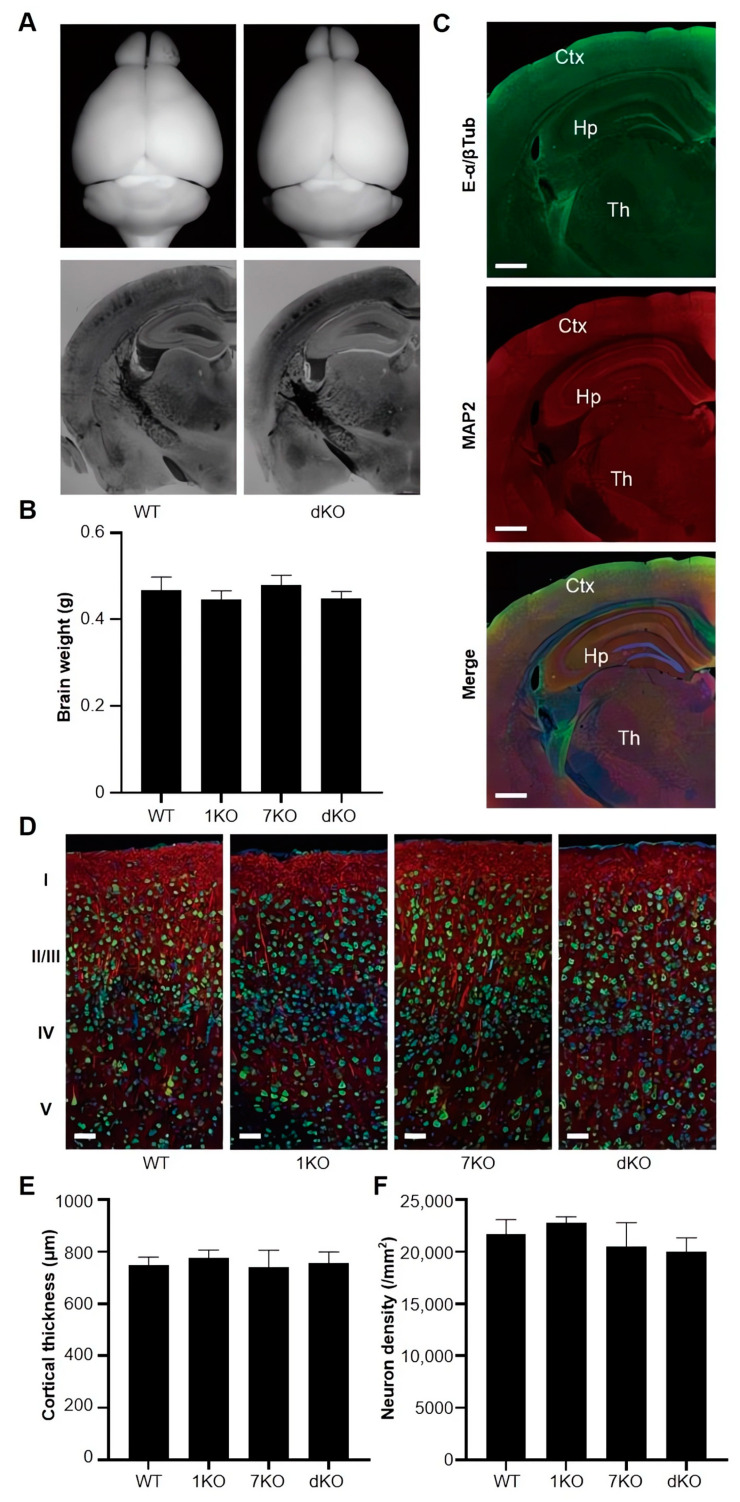
Figure 4.
Overall structures of brains from Ttll knockout mice. (A) Whole views (upper panels) and cress sectional views (below panels) of the WT and Ttll1/Ttll7 double knockout mice. (B) Brain weight of transgenic mice indicating that Ttll knockout did not affect the weight of the brain, (WT: n = 4 mice; 1KO: n = 4 mice; 7KO: n = 4 mice; dKO: n = 4 mice). (C) WT mice brain sections were reacted with antibodies against glutamylated tubulin (upper panel, green, E- α/β Tub) and MAP2 (middle panel, red). The merged Figure (below panel) shows that glutamylated tubulins are dominant on the surface of the cortex region. It was also stained by Hoechst 33342 for nucleus imaging. Scale bars: 0.5 mm. (D) Immunostaining of cerebral cortexes from Ttll knockout mice stained with NeuN antibody (green) and anti-MAP2 antibody (red). Scale bars: 20 μm. (E,F) Cortical thicknesses (E) and neuron densities (F) from Ttll knockout mice indicated no differences in the number of neurons in this area among WT and Ttll knockout mice, (WT: 9 cortical sections, n = 3 mice; 1KO: 9 cortical sections, n = 3 mice; 7KO: 9 cortical sections, n = 3 mice; dKO: 9 cortical sections, n = 3 mice). Data represented as mean ± SD in (B,E,F), unpaired t test. Abbreviations: 1KO: Ttll1 knockout; 7KO: Ttll7 knockout; dKO: Ttll1/Ttll7 double knockout.

