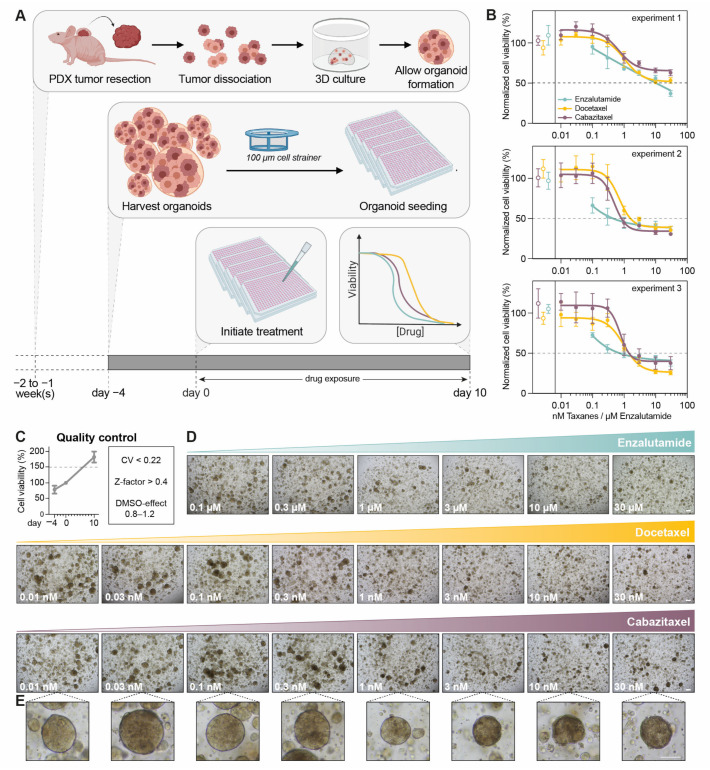
Figure 2.
Optimization of PCa PDXO viability assays. (A) Schematic overview. (B) Reproducibility of the optimized procedure. Three independent experiments of PC2416-DEC PDXOs exposed to dose ranges of enzalutamide, docetaxel and cabazitaxel (mean +/− SD of six technical replicates per condition). Normalization to all untreated controls per experiment. Open dots represent untreated controls of each treatment plate. Data from [3], analyzed for individual experiments. (C) Quality control metrics of experiments in (B): i. increase in organoid viability of ≥ 1.5 between day 0 and day 10 (mean +/− SEM of three experiments; from 6 to 18 technical replicates for each timepoint); ii. coefficient of variation (CV) < 0.22 and Z-factor > 0.4 for each treatment plate; iii. DMSO effect between 0.8 and 1.2 for each enzalutamide treatment plate. (D) Representative brightfield images of PC2416-DEC PDXOs exposed to dose ranges of enzalutamide, docetaxel and cabazitaxel. Scale bar 100 μm. (E) Detail of a single organoid for each dose of cabazitaxel. Scale bar: 100 μm.

