Figure 3.
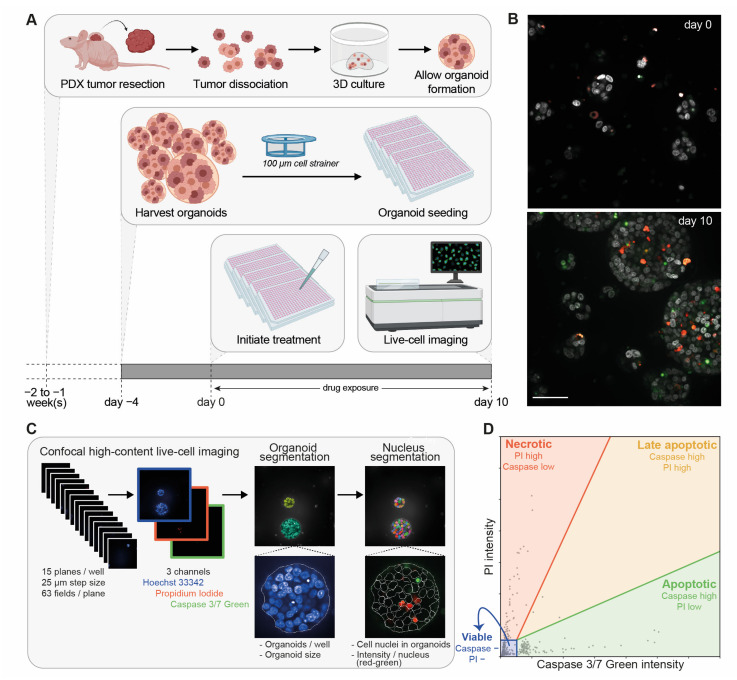
Optimization of confocal high-content live-cell imaging for drug testing in PCa PDXOs. (A) Schematic overview. (B) Representative confocal images of PC346C PDXOs stained with Hoechst 33342 (grey), Caspase 3/7 Green (green) and propidium iodide (red) before treatment initiation (day 0) and after drug exposure (day 10; untreated control). Images display the maximum projection of individual planes with step sizes of 25 μm. Scale bar represents 50 μm. (C) Schematic overview of our image analysis pipeline. Organoid segmentation is based on the combined image of all three fluorescent channels (Hoechst 33342, PI and Caspase 3/7 Green) and allows the quantification of the number of organoids per well and the mean organoid sizes (μm2). Within the segmented organoids, cell nuclei were identified and quantified based on nuclear Hoechst 33342 staining. Mean propidium iodide intensity (red) and Caspase 3/7 Green intensity (green) were determined per nucleus. (D) Schematic representation of image-based cell death identification using Caspase 3/7 Green intensity and propidium iodide (PI) intensity. Each data point represents one nucleus. Gating identified four cell populations: apoptotic cells (green; high Caspase 3/7 Green and low PI intensity), necrotic cells (red: high PI and low Caspase 3/7 Green intensity), late apoptotic cells (yellow: high Caspase 3/7 Green and high PI intensity) and viable cells (blue: negative (−) for both Caspase 3/7 Green and PI).

