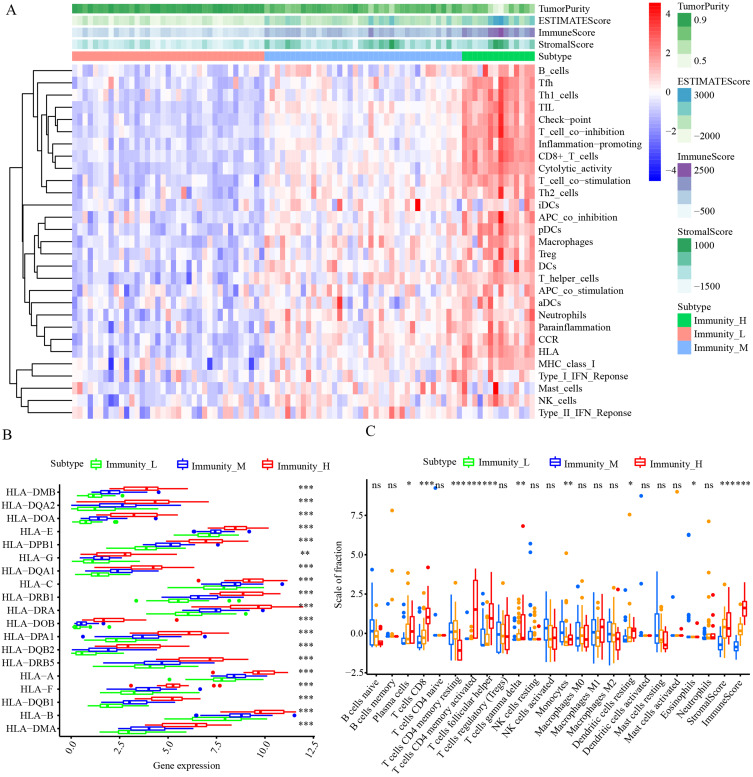
Figure 2.
Immune infiltration scoring for three clusters. (A) Landscape of the characteristics of immune infiltration in the TCGA cohort. (B) Comparison of the expression levels of HLA genes between three clusters. (C) Comparison of the immune cell infiltration levels between three clusters. *P < 0.05; **P < 0.01; ***P < 0.001.

