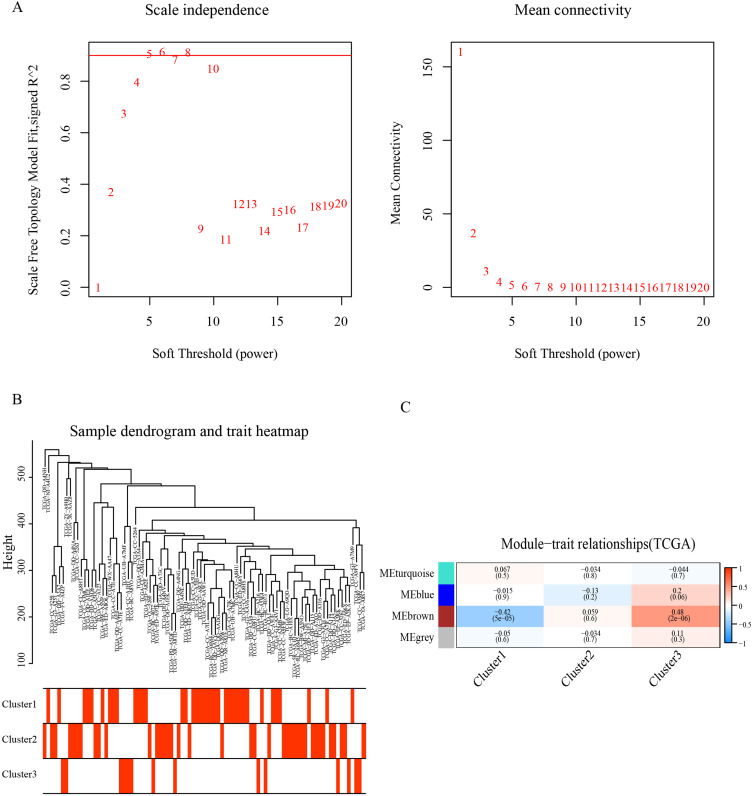
Figure 3.
Weighted Gene Co-expression Network Analysis (WGCNA). (A) Analysis of scale-free fit index for various soft-thresholding powers and the mean connectivity for various soft-thresholding powers. (B) Clustering tree of 1597 ubiquitination related genes. (C) Heat map of the correlation between the characteristic genes of the module and the immune infiltration characteristics of HCC.

