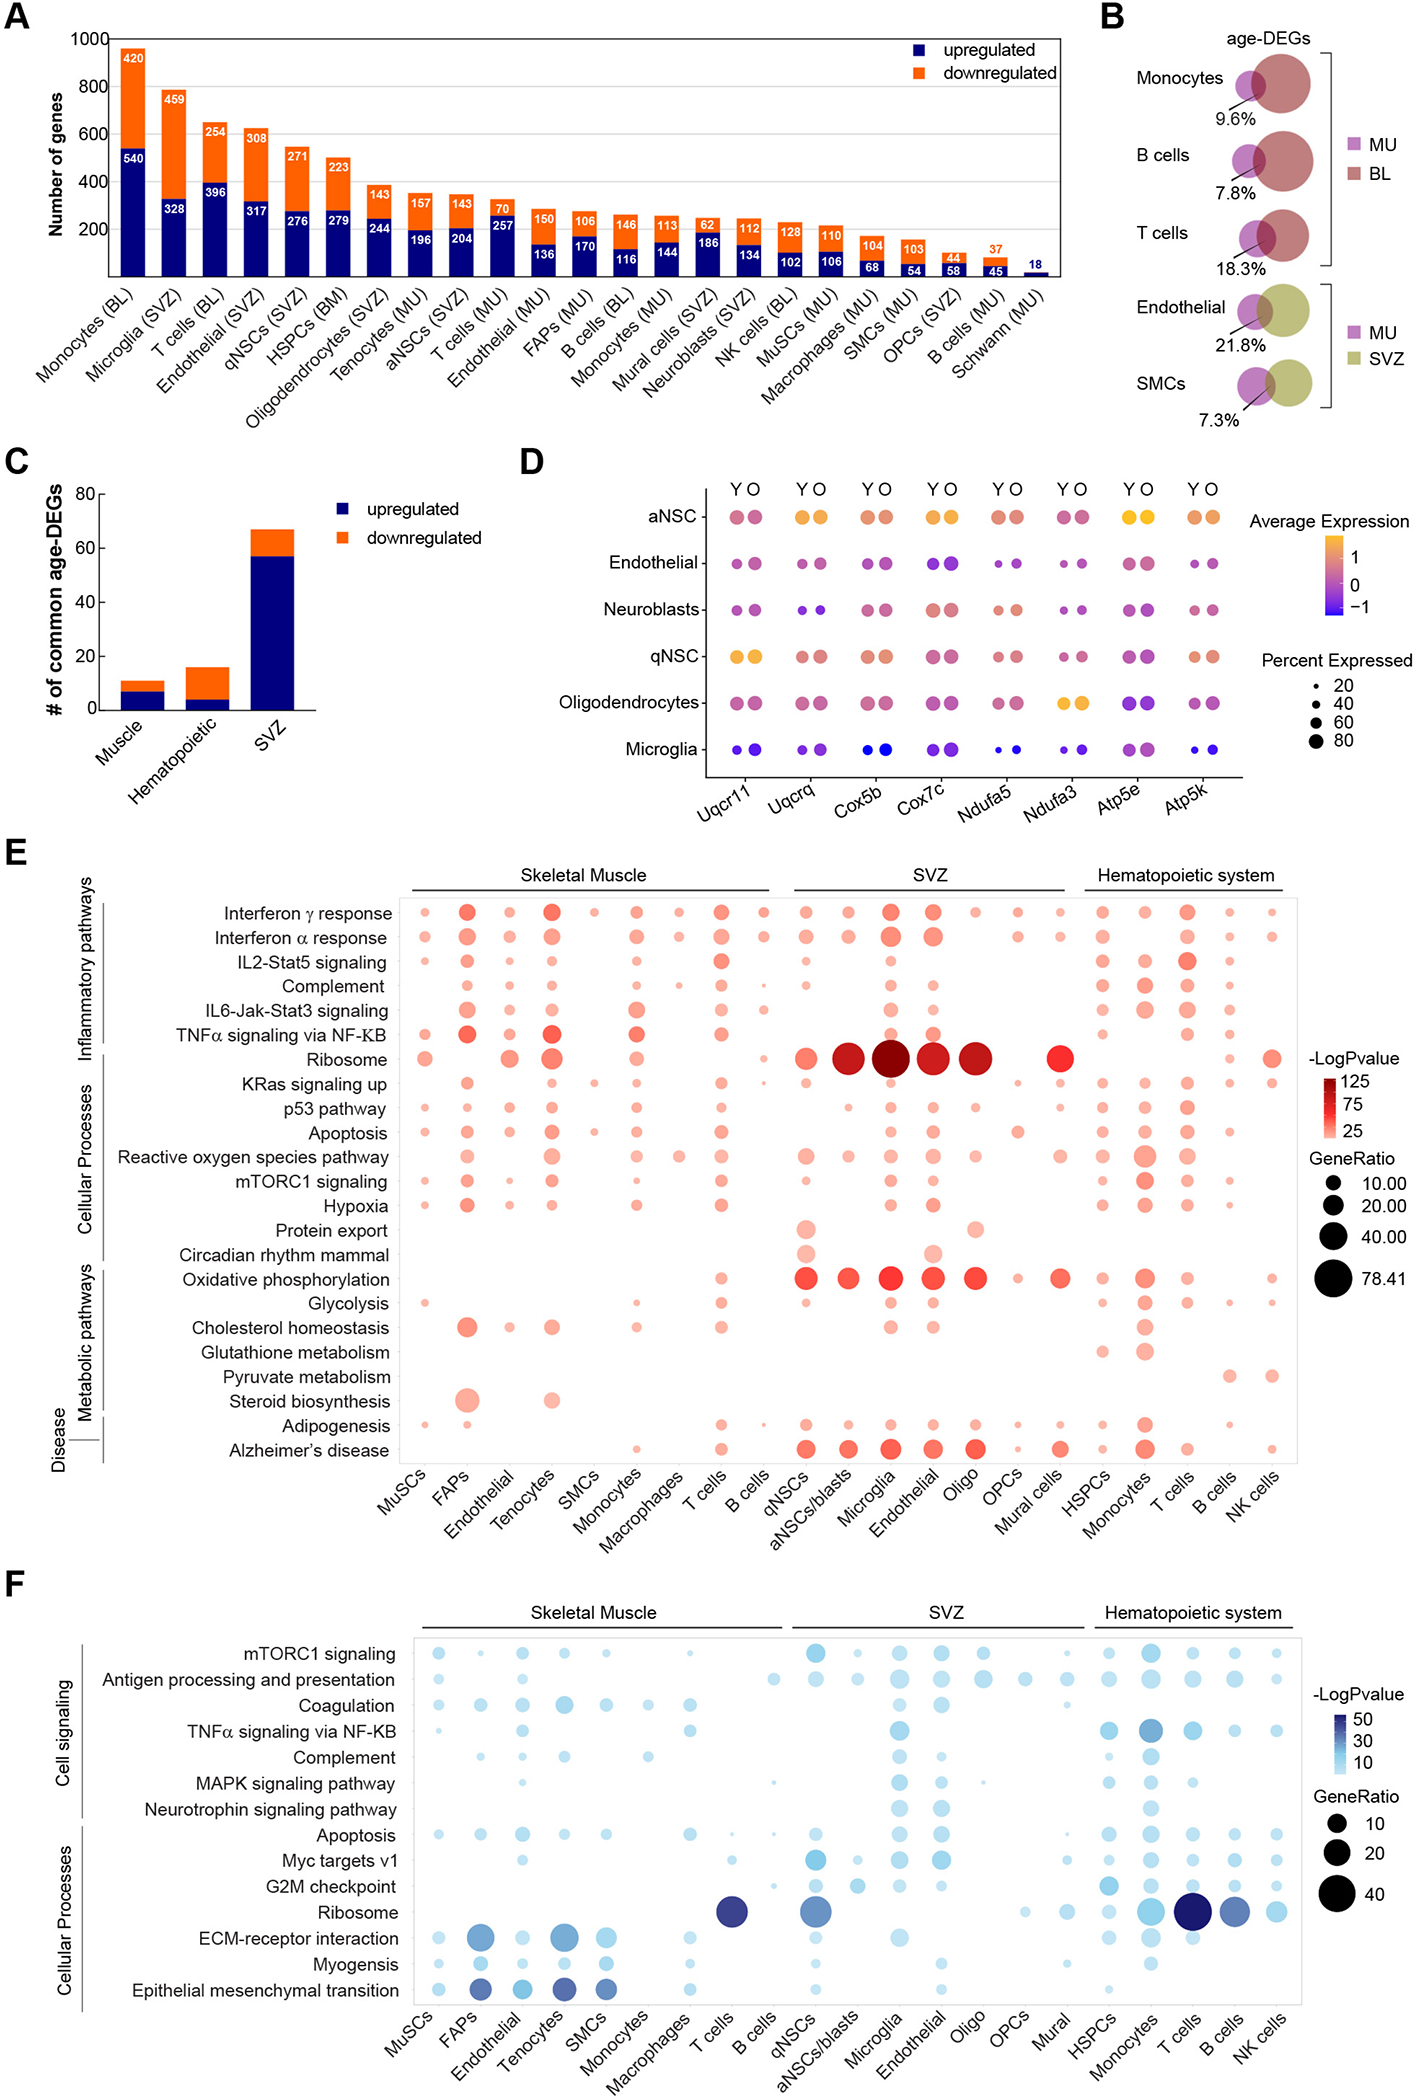
Figure 2: Effect of aging on the transcriptome of stem cells and niches cells.

(A) Summary of the number of upregulated and downregulated age-DEGs in major cell clusters in all 3 tissues. Cell types are ranked by the total number of age-DEGs. (B) Venn diagrams demonstrating the percentage of common age-DEGs in specific cell types from different tissues. The size of the circles is proportional to the number of age-DEGs. (C) The number of common age-DEGs in the 3 stem cell compartments. (D) Dot plot demonstrating the expression of selected genes encoding enzymes involved in oxidative phosphorylation in SVZ cells from young and old animals. (E) Dot plot summarizing common biological pathways enriched among upregulated age-DEGs in major cell types of muscle, the SVZ, and the hematopoietic system. (F) Dot plot summarizing common biological pathways enriched among downregulated age-DEGs in major cell types of muscle, the SVZ, and the hematopoietic system.
