
Figure 5: Cell-cell communication in the MuSC niche.
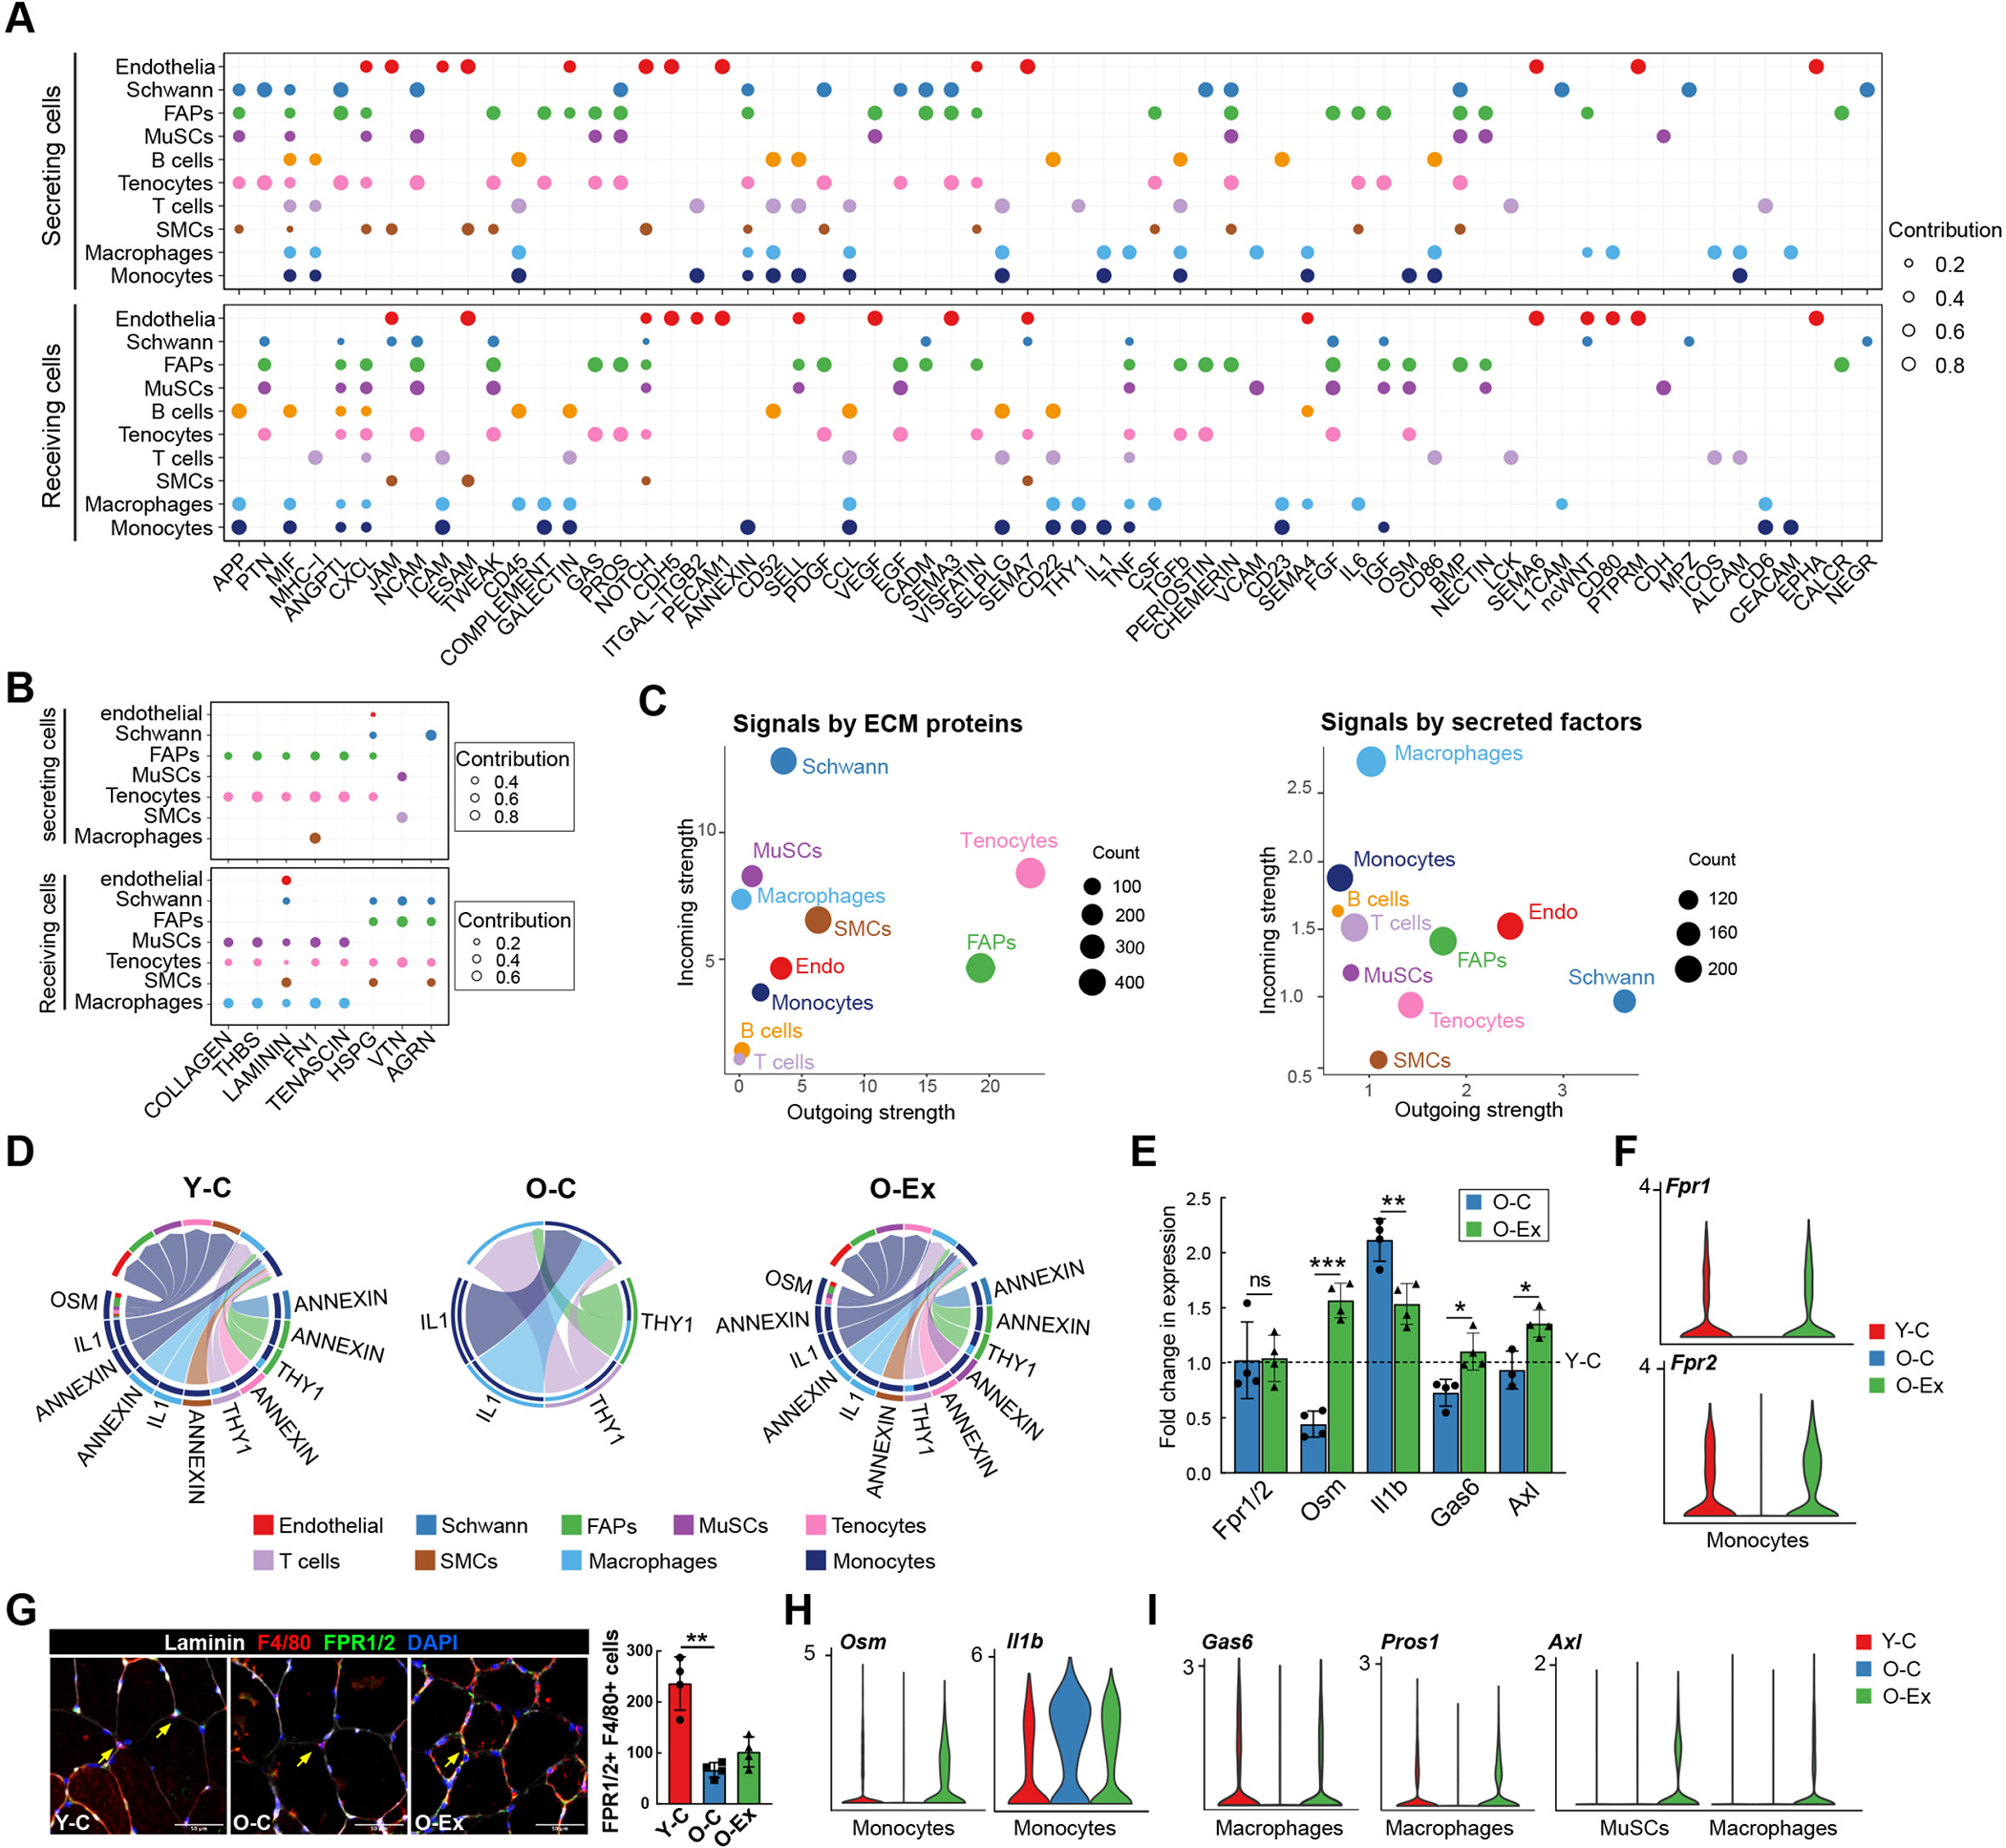
(A) Dot plot summarizing the signal sending and receiving cells for each listed pathway mediated by secreted or cell surface molecules in skeletal muscle. The size of the dots is proportional to the contribution of a cell type to a specific pathway. (B) Dot plot summarizing the signal sending and receiving cells for each listed pathway mediated by ECM signaling in skeletal muscle. (C) Scatter plot showing the contribution of each cell type in the muscle to secreted/cell surface molecule-mediated communication (left) and to ECM-mediated communication (right). The size of the dots is proportional to the total number of incoming and outgoing signaling pathways associated with a cell type. (D) Chord plots showing cell-cell communication mediated by the ANNEXIN, OSM, IL1, and THY1 pathways in the muscle stem cell niche. The lower section of the circle represents signal sending cells and the top section of the circle represents signal receiving cells. At the lower section, the color bars at the outer circle represent signal sending cells, and those at the inner circle represent signal receiving cells. The arrows point to signal receiving cells. Note that ANNEXIN signaling and OSM signaling become undetectable with age but are restored by exercise. (E) Bar graph demonstrating the relative expression Fpr1, Osm, Il1b, Gas6, and Axl in muscle macrophages from O-C and O-Ex mice. For each gene, the fold changes in expression in comparison to the level in young control animals (Y-C, indicated by the dotted line) were plotted. n=4 mice. Data are shown as mean ± SEM. *p < 0.05, **p<0.01, ***p < 0.001 (unpaired t tests). (F) Violin plots showing the expression of Fpr1 and Fpr2 in muscle monocytes. (G) Representative images of muscle cross sections stained with Fpr1/2 antibodies. Monocytes/macrophages were co-stained with the F4/80 antibody and marked by the arrows. The number of total Fpr1/2 expressing monocytes/macrophages were quantified on the entire cross section and plotted in the bar graph shown on the right. n=4 mice. Data are shown as mean ± SEM. *p < 0.05, **p<0.01, ***p < 0.001 (unpaired t tests). (H) Violin plots showing the expression of Il1b and Osm in muscle monocytes. (I) Violin plots showing the expression pattern of Axl, Gas6, and Pros1 in MuSCs and muscle macrophages.