
Figure 6: Cell-cell communication in the NSC niche.
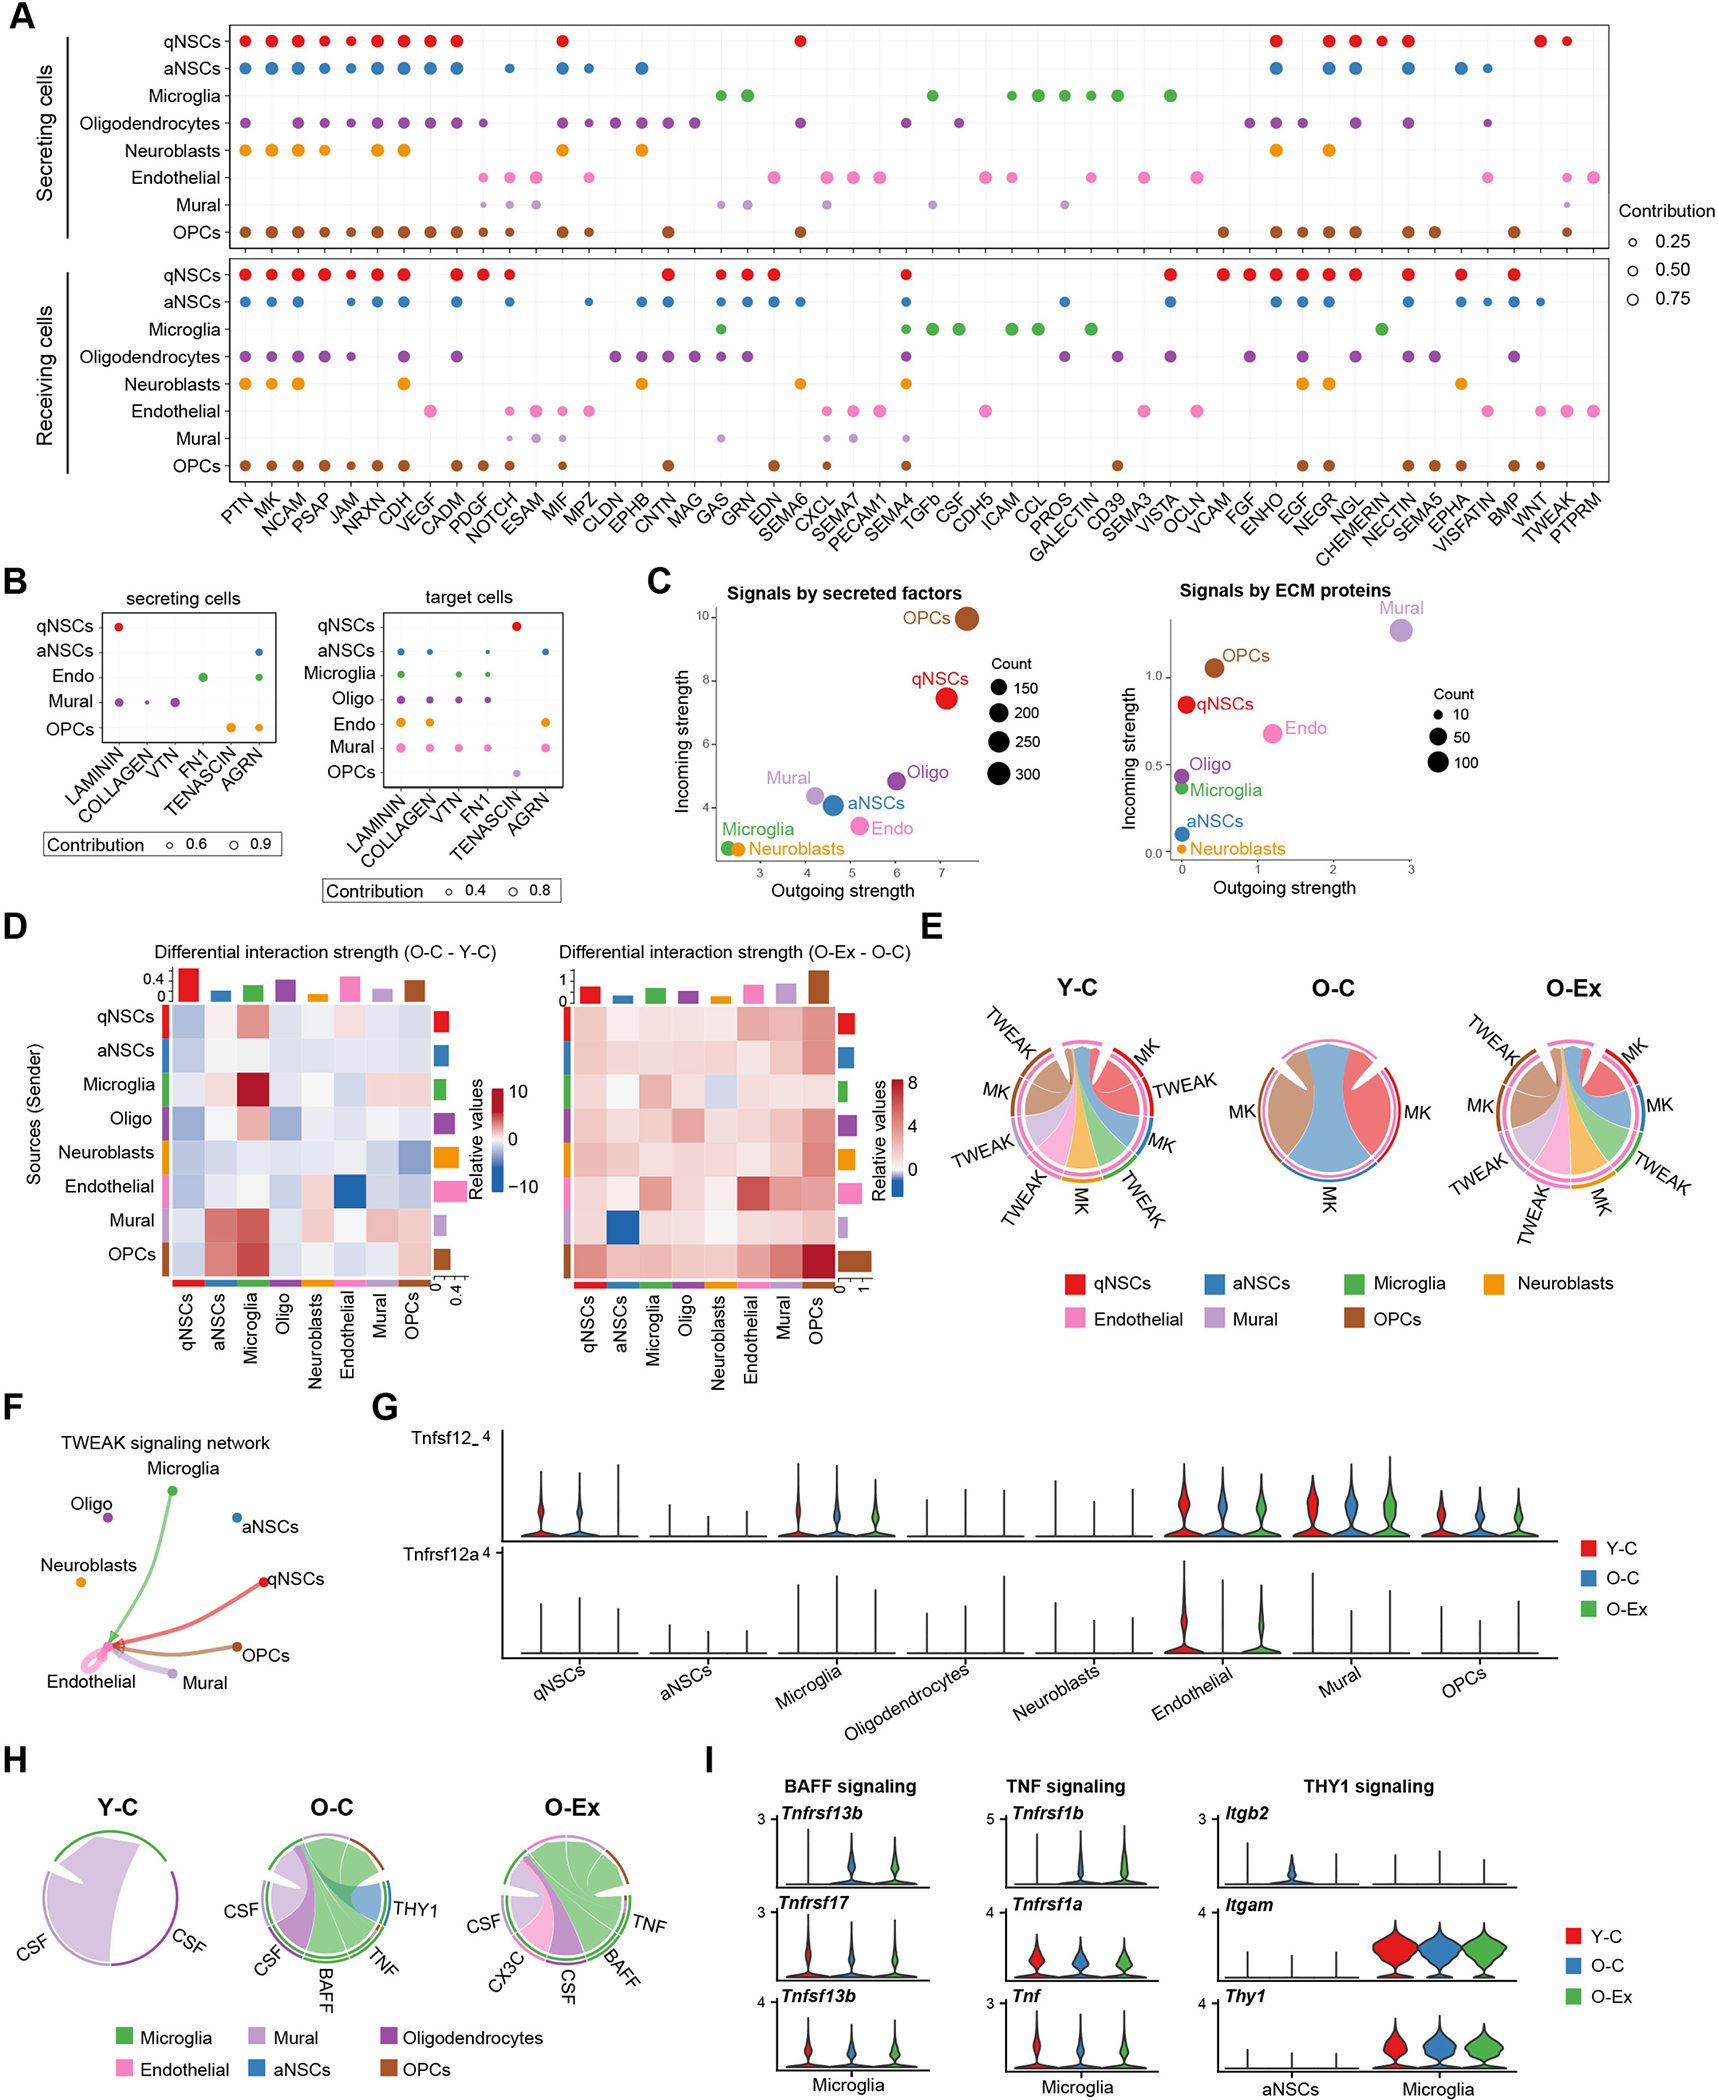
(A) Dot plot summarizing the expression pattern of secreted and cell surface signaling molecules and their receptors in the SVZ. The size of the dots is proportional to the contribution of a cell type to a specific pathway. (B) Dot plot summarizing the signal sending and receiving cells for each listed pathway mediated by ECM signaling in the SVZ. (C) Scatter plot showing the contribution of each cell type in the SVZ to secreted/cell surface molecule-mediated communication (left) and to ECM-mediated communication (right). The size of the dots is proportional to the total number of incoming and outgoing signaling pathways associated with a cell type. (D) Heatmaps showing the differential overall signaling strength in the SVZ between Y-C and O-C (left) and between O-C and Y-Ex (right) mice. The top bars and right bars represent the sum of incoming and outgoing signaling strength of each cell type, respectively. On the left, red and blue represent higher and lower signaling strength in the O-C mice, respectively, in comparison to Y-C mice. On the right, red and blue represent lower and higher signaling strength in the O-C mice, respectively, in comparison to O-Ex mice. (E) Chord plots showing the TWEAK and MK signaling network in the SVZ. Note that TWEAK signaling disappears in O-C and recovers in O-Ex. The arrows point to signal receiving cells. (F) Circle plot demonstrating the TWEAK signaling network in the SVZ. The thickness of the lines represents signaling strength; the color of the lines represents the source of the signal and the arrows point toward signal receiving cells. (G) Violin plots showing the expression pattern of the TNFSF12 ligand and the TNFRSF12A receptor in SVZ cells. (H) Chord plots showing the CSF, BAFF, TNF, THY1, and CX3C signaling networks in SVZ cells. (I) Violin plots showing the expression pattern of the BAFF, TNF, and THY1 signaling components in microglia.