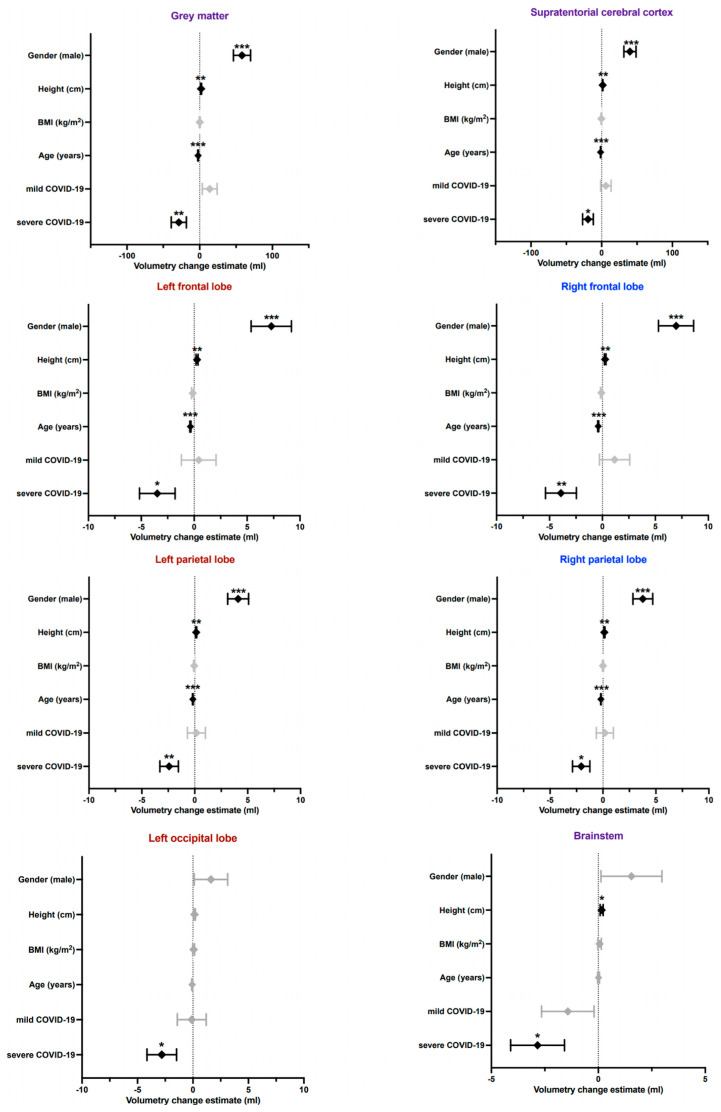
Figure 2.
Graphically illustrated results of multivariate modelling in selected brain areas showing the amount by which the dependent variable (volume in mL of a certain brain area) changes when the independent variable increases by one unit (years for age, cm for height and kg/m2 for BMI, severity MILD or SEV for COVID-19). Unilateral or whole brain structures are labelled purple, whereas areas on the left are red, and those on the right are blue. *= p ≤ 0.05, **= p ≤ 0.01, ***= p ≤ 0.001.

