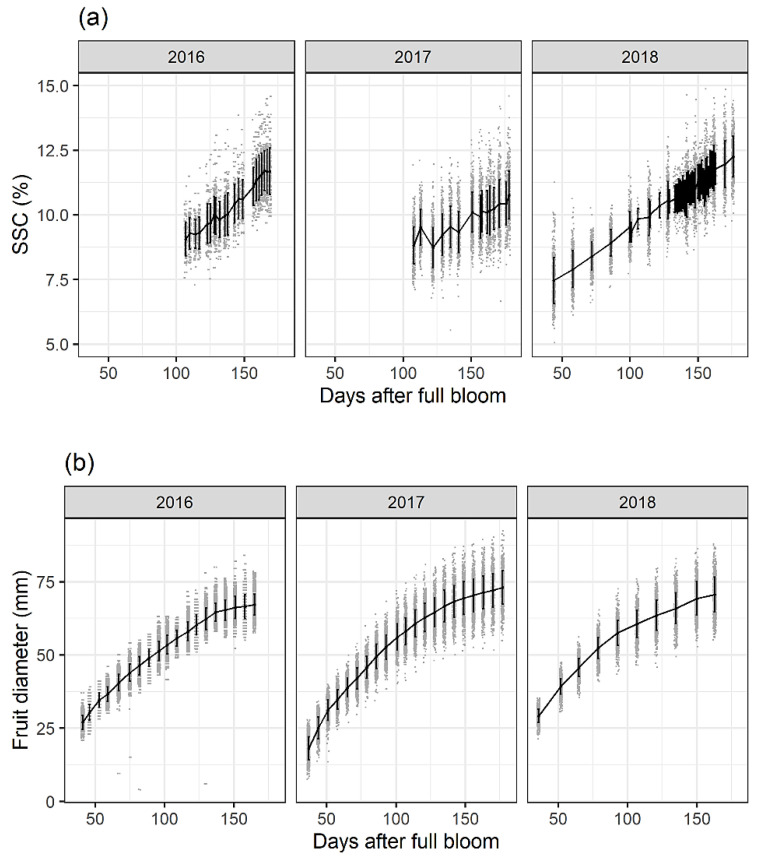
Figure 7.
Soluble solids content (SSC) accumulation derived from the yearly calibrated partial least squares regression models (a) and fruit diameter growth (b) for the three study years and all treatments are shown. Mean values per measurement day are plotted as solid lines, single values as grey dots, and +/− standard deviations as black vertical bars. Reprinted with permission from Ref. [171]. 2021, MDPI (CC BY 4.0).

