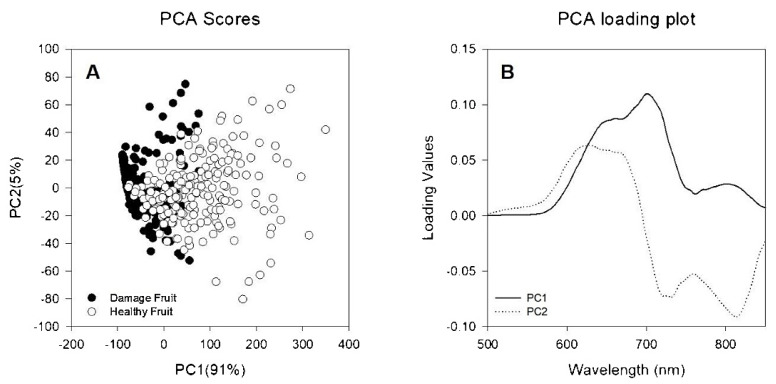
Figure 16.
Principal component (PC) analysis of “Cripps Pink” apple semi-transmittance spectra between 600 and 830 nm after 150 d plus 7 d at 20 °C. (A) Score plot. Black dots correspond to damaged fruit, white dots correspond to healthy fruit. (B) Loading plot. Continuous line shows loading values for PC1, dotted line shows loading values for PC2. Reprinted with permission from Ref. [333]. 2020, Elsevier.

