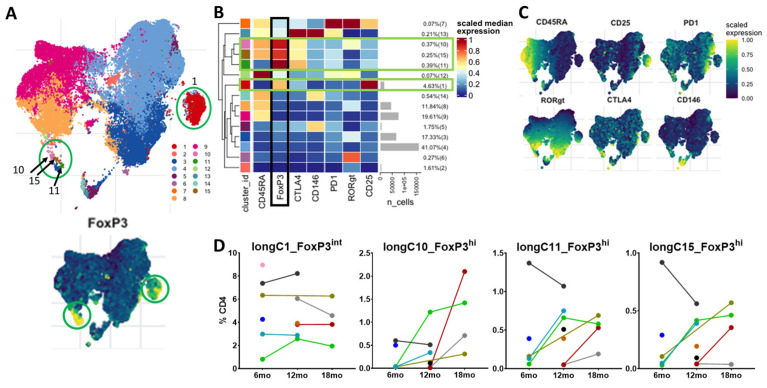
Figure 6.
Unsupervised clustering of unstimulated cells from long-term time points reveals a predominant CD4+ FoxP3int-expressing cluster and three small FoxP3hi clusters. (A). UMAPs of the unsupervised clustering of the concatenated files of CD45+CD3+CD4+ cells at the 6-, 12- and 18-month time points following surgery in 10 individual patients. In the upper UMAP, each cluster has a corresponding number and color. The lower UMAP demonstrates the relative expression of FoxP3. Green circles highlight the four Treg clusters (longC1_FoxP3int, longC10_FoxP3hi, longC11_FoxP3hi and longC15_FoxP3hi). (B). Heatmap demonstrating the relative scaled median marker expression, cell numbers and percentages of the total sample of each of the fifteen CD45+CD3+CD4+ clusters. Clusters longC1_FoxP3int, longC10_FoxP3hi, longC11_FoxP3hi, and longC15_FoxP3hi have the expression of FoxP3, CD25 and CTLA-4, indicating that they are Tregs. Green bars highlight the four Treg clusters. The black bar highlights the relative expression of FoxP3. (C). UMAPs demonstrating the scaled, relative expression of markers used to generate the 15 clusters. (D). Matched dot plots of the four Treg clusters at the long-term timepoints (6 months n = 6, 12 months n = 6, 18 months n = 4), demonstrating variability of the clusters among patients. Dots connected by lines indicate individual patients, each color is an individual patient. The small number of patients at each time point limits statistical analysis.

