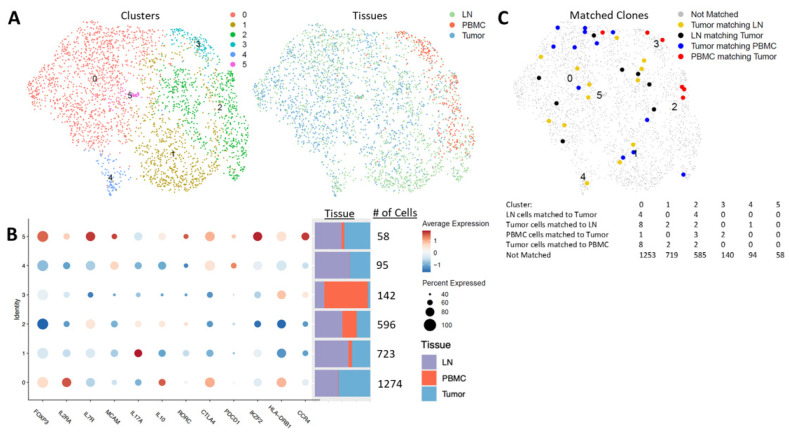
Figure 7.
Paired single-cell RNA/TCR sequence clustering reveals six CD4+ Foxp3-expressing clusters within the blood, tumors and lymph nodes. (A). UMAPs of unsupervised clustering of patients (n = 5) from single-cell RNA sequencing analysis from combined peripheral blood (PBMCs), tumors and lymph nodes (LNs) of CD4+FoxP3+ cells. The left UMAP demonstrates the six clusters, with each cluster having a corresponding number and color. The right UMAP highlights the tissues that make up each cluster. (B). Dot plots showing the relative gene expression of the six CD4+FoxP3+ clusters, the cell number in each cluster and the proportion of cells isolated from lymph nodes (LNs), peripheral blood (PBMC) and tumors comprising each cluster. Circle size corresponds to the percentage of cells in each cluster and the color indicates the relative gene expression (high = red, low = blue). (C). UMAP highlighting the numbers of matched clones in each cluster by single-cell TCR sequencing. Colored dots indicate a clonal match corresponding to the associated key, and grey dots indicate the clones that are not matched across tissue types. The table denotes the exact number of matched clones by tissue in each cluster.

