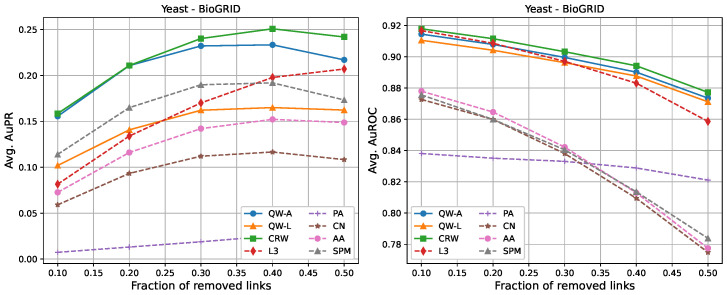
Figure 6.
Average areas under the precision–recall curve (left) and average areas under the receiver operating characteristic curve (right) as a function of the fraction of true links that were removed from the BioGRID Saccharomyces cerevisiae PPI network [46]. Plotted values are the averages over 10 runs. Our walks used a hyperparameter of .

