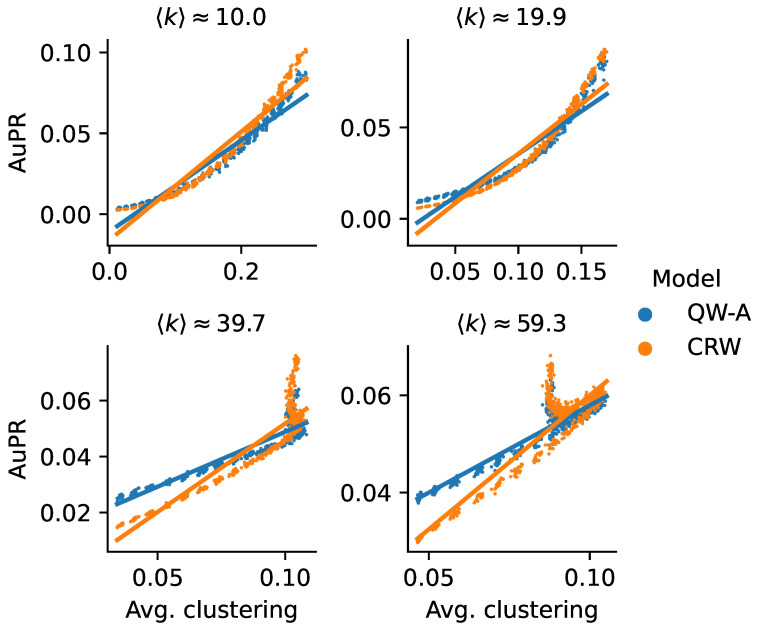
Figure 10.
AuPRs for scale-free networks with tunable clusterings. Four different settings are shown, corresponding to different (approximate) average degrees. In each setting, the average clustering was varied to produce different networks. In the resulting networks, half of the edges were reserved for testing, and the remaining network was used to run the QW-A and CRW link prediction methods on. Each point corresponds to the AuPR of a generated network; solid lines show linear fits. Each plot title shows the average degree , averaged over all networks.

