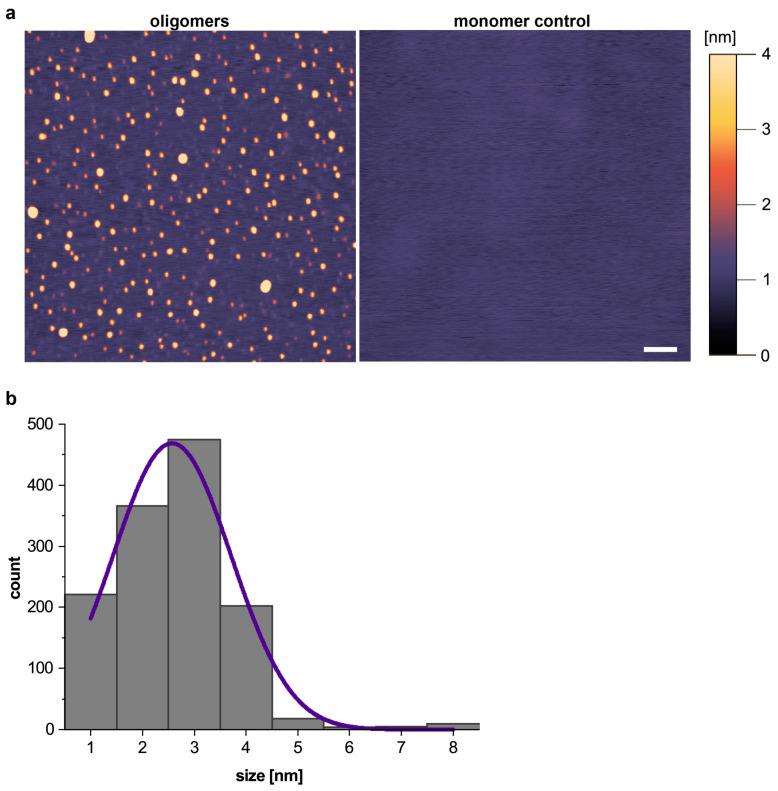
Figure 2.
Analysis of the Aβ oligomers measured by AFM. (a) AFM images of the monomer control and Aβ oligomer samples. The color scale indicates the height profile. Scale bar = 200 nm. (b) Histogram showing the size distribution of 1300 oligomers. Abbreviations: Aβ, amyloid-β; AFM, atomic force microscopy.

