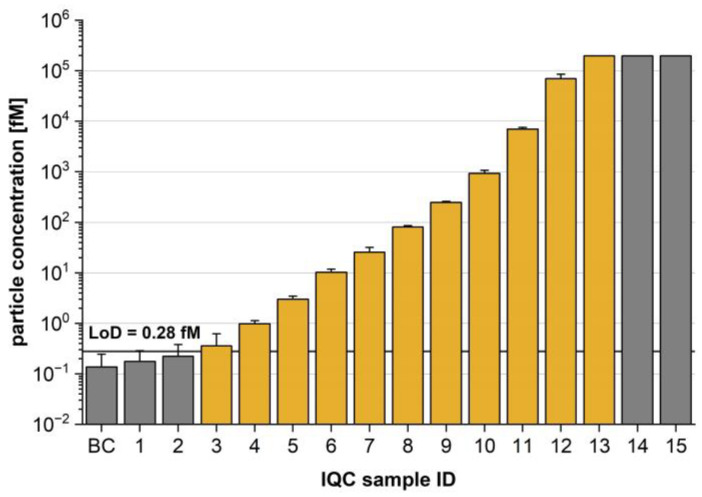
Figure 3.
Molar particle concentration of internal quality control (IQC) samples and blank control (BC). On the basis of 24 replicates of the BC, the limit of detection (LoD) was calculated and translated into a particle concentration of 0.28 fM using the calibration curve. The linear working range (yellow) was identified by acceptable dilution linearity between the upper (196 pM) and lower (0.36 fM) limits of quantification. Note the logarithmic scale. Data are presented as the mean and standard deviation of four replicates.

