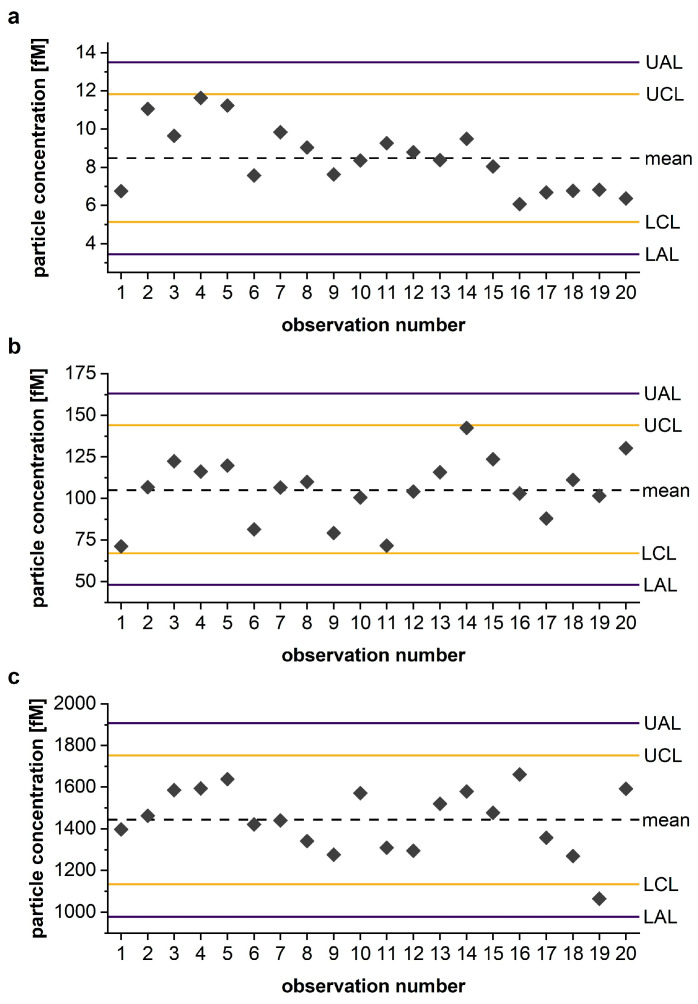
Figure 5.
Shewhart chart monitoring the performance of IQC-6 (a), IQC-8 (b) and IQC-10 (c). The calibrated particle concentrations of 20 observations of each IQC sample (gray dots) were plotted to simulate assay performance in chronological order. Mean: central dashed line; upper and lower control limit (UCL, LCL): yellow line; upper and lower action limit (UAL, LAL): purple line. Data are presented as the mean of four replicates (gray data points). Abbreviation: IQC, internal quality control.

