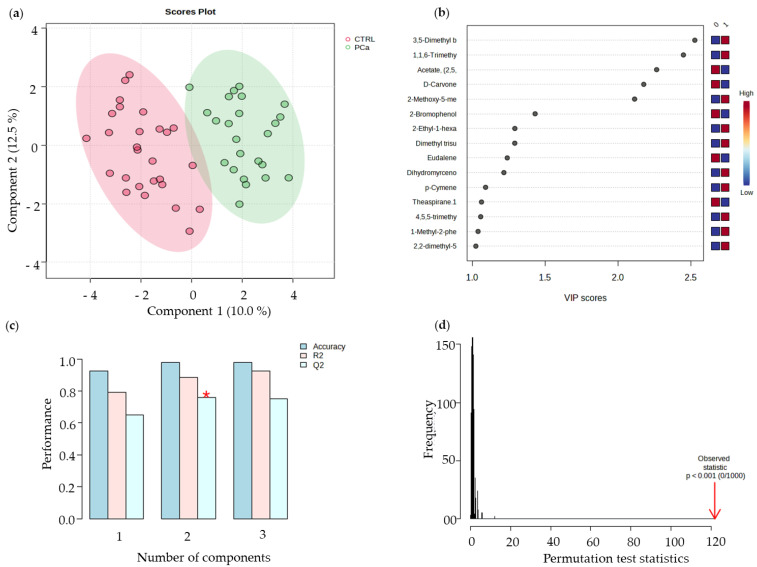
Figure 4.
(a) Partial least-squares discriminant analysis (PLS-DA). (b) Variables of importance in projection (VIP) scores plot, representing the important features identified by the PLS-DA. The coloured boxes on the right indicate the relative concentrations of the corresponding metabolites in each group under study. (c) 10-fold CV performance of the PLS-DA classification using a different number of components (* means best Q2 value, the best classifier). (d) PLS-DA model validation by permutation tests based on 1000 permutations of the VOMs obtained by GC-MS of the urine samples from the groups under study.

