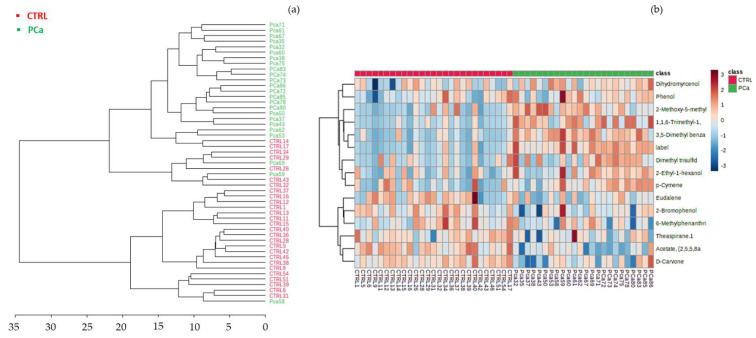
Figure 5.
Hierarchical cluster analysis of CTRL (control) and Pca (prostate cancer) groups (a) Dendrogram analysis of the volatomic data, using Euclidean distance measure and Ward’s linkage. (b) Clustering result shown as heatmap illustrates the concentration of the urinary volatile organic metabolites identified in each sample. Columns correspond to Pca and CTRL sample groups, respectively, whereas rows correspond to the most relevant VOMs detected. The colour of the cells corresponds to the normalised peak areas of the compounds (minimum −1, dark blue; maximum +1, dark red).

