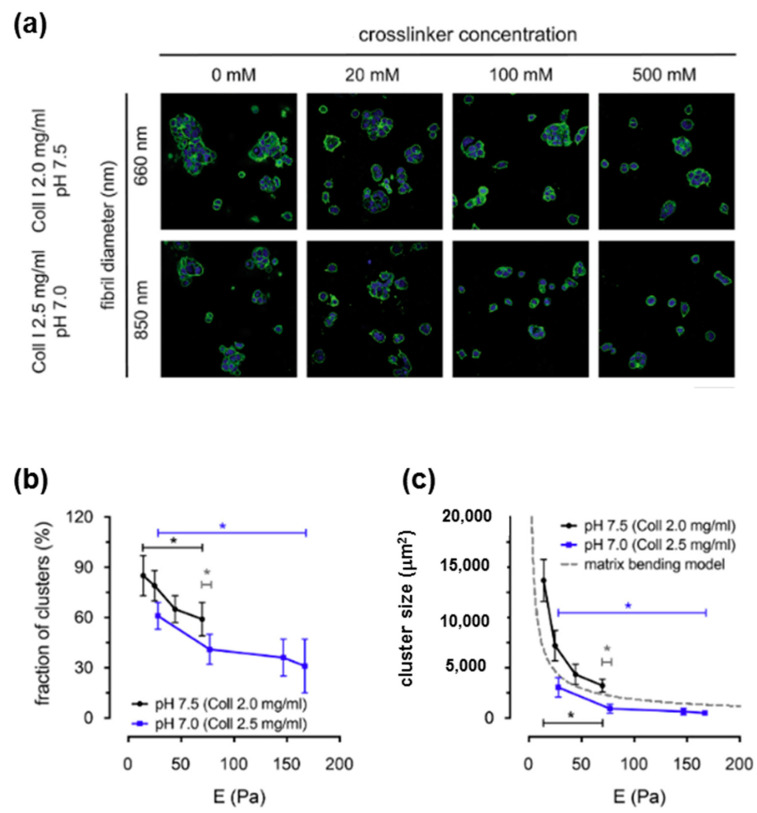
Figure 18.
Correlation between Coll I fibril bending stiffness and cell clustering of MCF-7 cells. (a) The confocal laser scanning microscopy images of MCF-7 breast cancer cells cultivated in 3D Coll I matrices with fibril diameters of 660 nm and 850 nm and with postmodification by different concentrations of the crosslinker (from 0 to 500 mM) after 5 days of cultivation. Images show nuclei (blue) and actin filaments (green). (Scale bar: 100 μm). (b,c) Quantitative analysis of cell clustering of MCF-7 cells. Cells without contact to other cells were assigned as single cells. Fraction of clusters (ratio of number of cell clusters and single cells) (b) and cluster size (c) were plotted as a function of matrix elastic modulus, E. Dashed line in (c) depicts the simple model of cluster formation limited by matrix bending energy (gray dashed line). Data are shown as mean ± SD; *—significance level of p < 0.05. Adapted with permission from [290], copyright 2019, Elsevier.

