. 2023 May 26;131(5):057010. doi: 10.1289/EHP10556

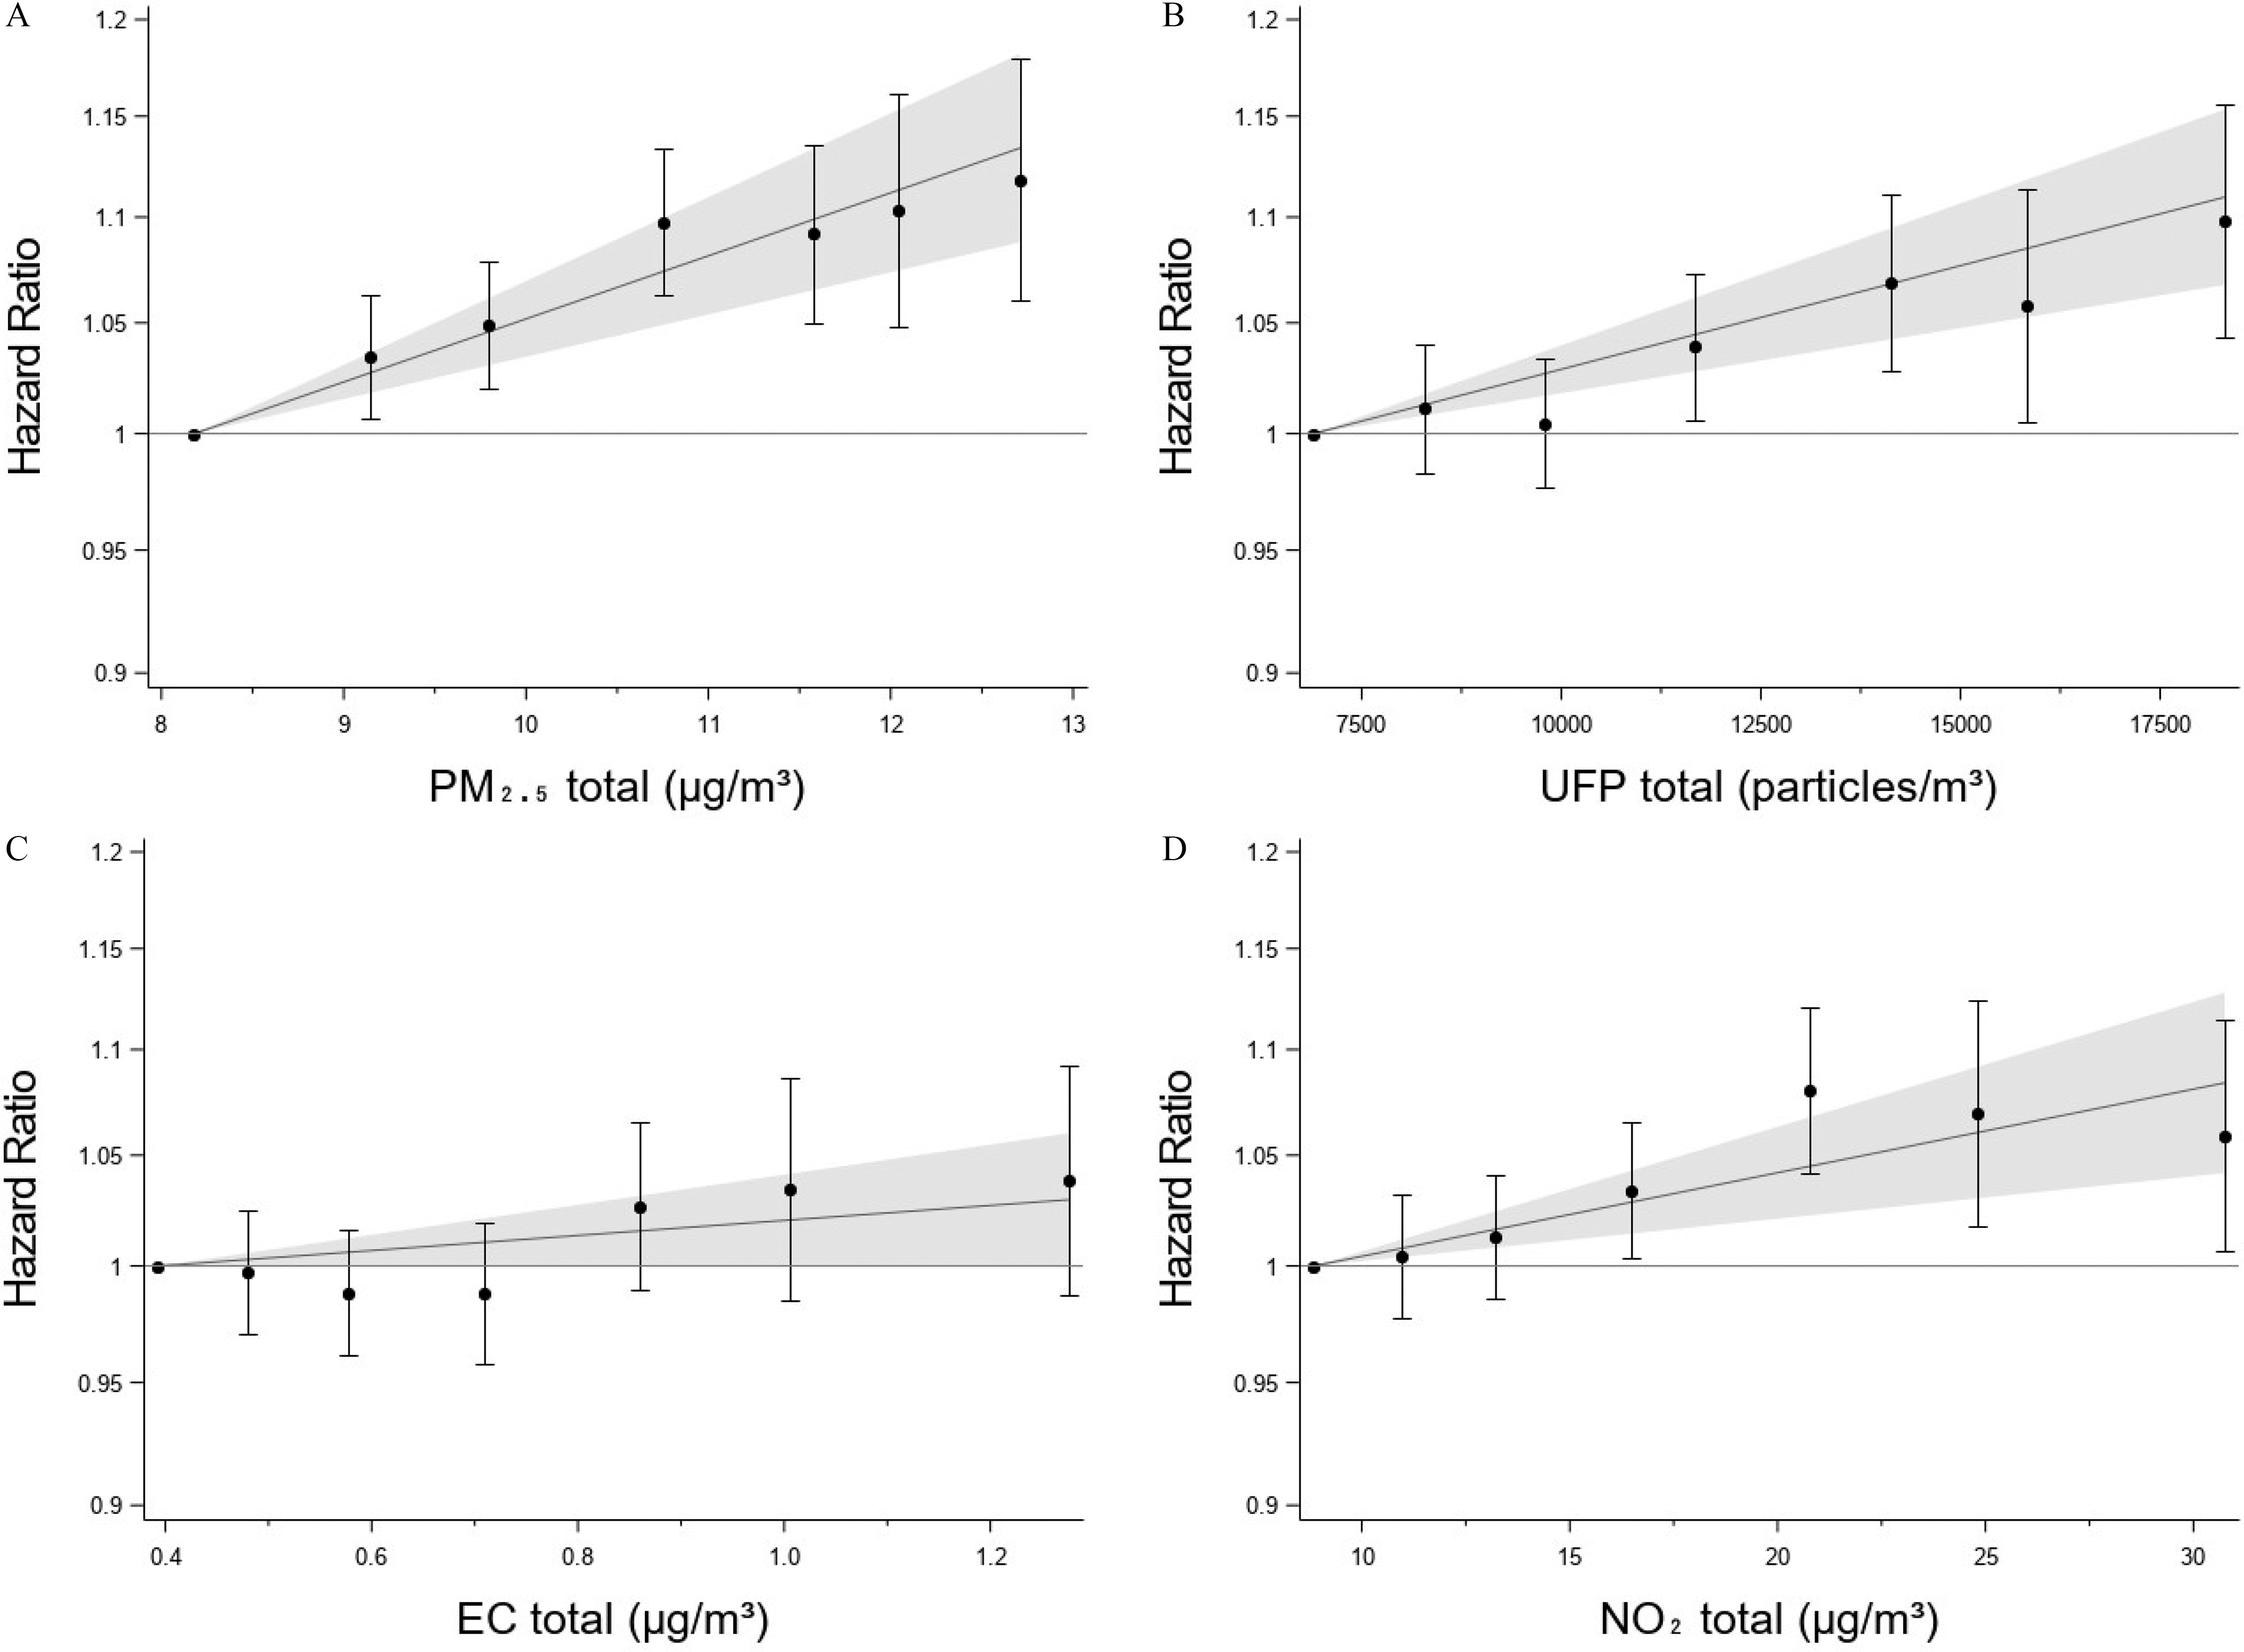
Figure 1.

Figures 1A to 1D are shaded error bar graphs, plotting hazard ratio, plotting 0.9 to 0.96 in increments of 0.06; 0.96 to 1 in increments of 0.04; 1 to 1.06 in increments of 0.06, 1.06 to 1.1 in increments of 0.04, 1.1 to 1.15 in increments of 0.05, 1.15 to 1.2 in increments of 0.05 (y-axis) across particulate matter begin subscript 2.5 end subscript total (microgram per meter cubed), ranging from 8 to 13 in unit increments; Ultrafine particles total (particles per meter cubed), ranging from 7500 to 17500 in increments of 2500; elemental carbon total (microgram per meter cubed), ranging from 0.4 to 1.2 in increments of 0.5; nitrogen dioxide total (microgram per meter cubed), ranging from 10 to 30 in increments of 5 (x-axis).

Associations between MI and 5-y time-weighted averages of (A) PM2.5, (B) UFP, (C) EC, and (D) NO2 specified both in categories and as linear variables in the fully adjusted model 3. Categories defined from percentile of exposure: <10% (reference), 10%–25%, 25%–50%, 50%–75%, 75%–90%, 90%–95%, and >95%; HRs and 95% CI plotted at the median of each category. The linear estimates from Table 2 with 95% CIs are plotted with the median of the categorical reference category as the null (i.e.,=1). (Table S3 holds the same information in tabulated form). Denmark, 2005–2017, N=1,964,702. Note: CI, confidence interval; EC, elemental carbon; MI, myocardial infarction; UFP, ultrafine particles.