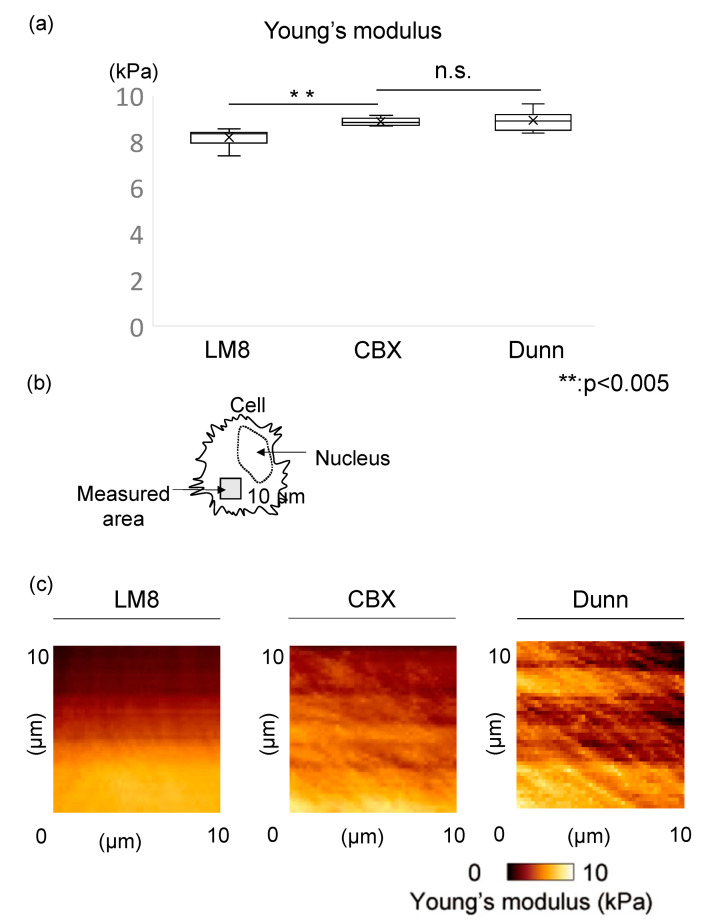
Figure 2.
Stiffness and actin localization in the cell. (a) The Young’s modulus was compared between control group (LM8), CBX treatment group, and low metastatic group (Dunn). LM8: 8.20 ± 0.36 kPa, CBX: 8.88 ± 0.16 kPa, Dunn: 8.95 ± 0.39 kPa. CBX treatment group was significantly stiffer than LM8 (p < 0.01). In the CBX treatment group, the stiffness was similar to Dunn. (b) Measured area using AFM was indicated in the scheme. (c) Young’s modulus images in control and CBX treatment were shown. In the CBX treatment group, the actin filaments in cells were distributed throughout the cell.

