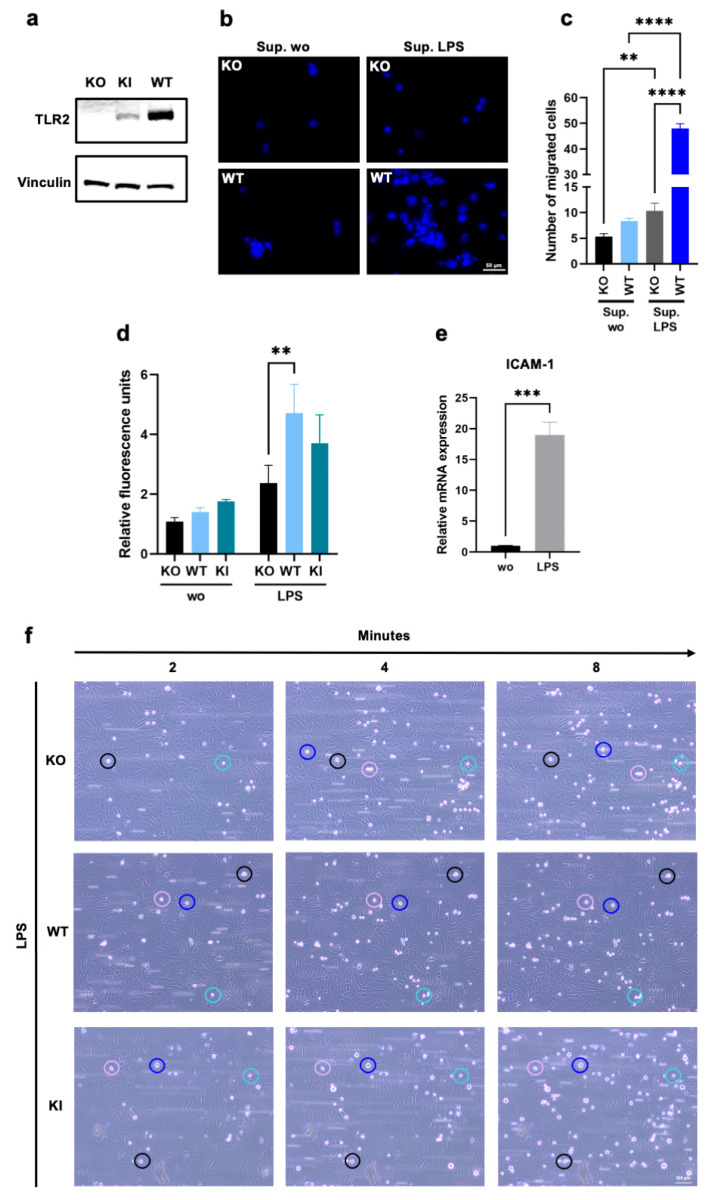
Figure 1.
Chemotactic migration and adhesion of THP-1 wild type (WT), TLR2 knock-out (KO), and TLR2 knock-in (KI) cells. (a) Western blot analysis using an antibody against Toll-like receptor 2 (TLR2) in THP-1 KO, WT, and KI whole cell lysates. Vinculin was used as a loading control. (b,c) Cells were stained with Hoechst 33342, seeded in the upper chambers of 24-well transwell plates, and allowed to migrate through a 5 µm porous membrane for 2 h towards the supernatants of lipopolysaccharide (LPS)-treated or untreated human lymphatic endothelial cells (LECs). (b) Migration of THP-1 KO and WT cells was visualized by fluorescence microscopy. The scale bar represents 50 µm, and Hoechst 33342 is shown in blue. (c) Bar graphs show mean values ± standard deviation (n = 5). One-way ANOVA, followed by Dunnett’s multiple comparison test, was performed to assess differences between KO and WT cells. (d) LECs were allowed to form a monolayer for 24 h and were stimulated with LPS for 4 h before THP-1 WT, KI, and KO cells (stained with Hoechst 33342) were allowed to adhere to the endothelial monolayer under shaking conditions for 15 min. Bar graphs show mean values ± standard deviation of relative fluorescence units (n = 3). Two-way ANOVA, followed by Dunnett’s multiple comparison test, was performed to assess differences between KO, WT, and KI cells (** p < 0.01; *** p < 0.001; **** p < 0.0001). (e) Primary human umbilical vein endothelial cell (HUVEC) monolayers were pretreated with conditioned media from LPS-stimulated whole blood for 4 h, and relative intercellular adhesion molecule-1 (ICAM-1) mRNA expression was assessed using the comparative CT method (2−ΔΔCT). Bar graphs show mean values ± standard deviation (n = 4). A t-test was performed to assess differences between untreated and treated cells. (f) After endothelial cell activation for 4 h under flow (5 dyn/cm2), cell adhesion of KO, WT, and KI cells was visualized by brightfield microscopy for 15 min with one image taken every 15 s. The scale bar represents 100 µm.

